Total Revenue
What is Total Revenue?
Total revenue is the sum of all business income from primary operations (gross revenue) before factoring in operating expenses. To find total revenue, use the following formula: Total Revenue = Monthly Recurring Revenue + Non-Recurring Revenue.
Typically, the primary revenue source for SaaS companies comes from selling software services to customers, such as recurring subscription fees and usage-based fees. However, some SaaS businesses have other non-recurring revenue-generating activities, such as professional consulting or training services.
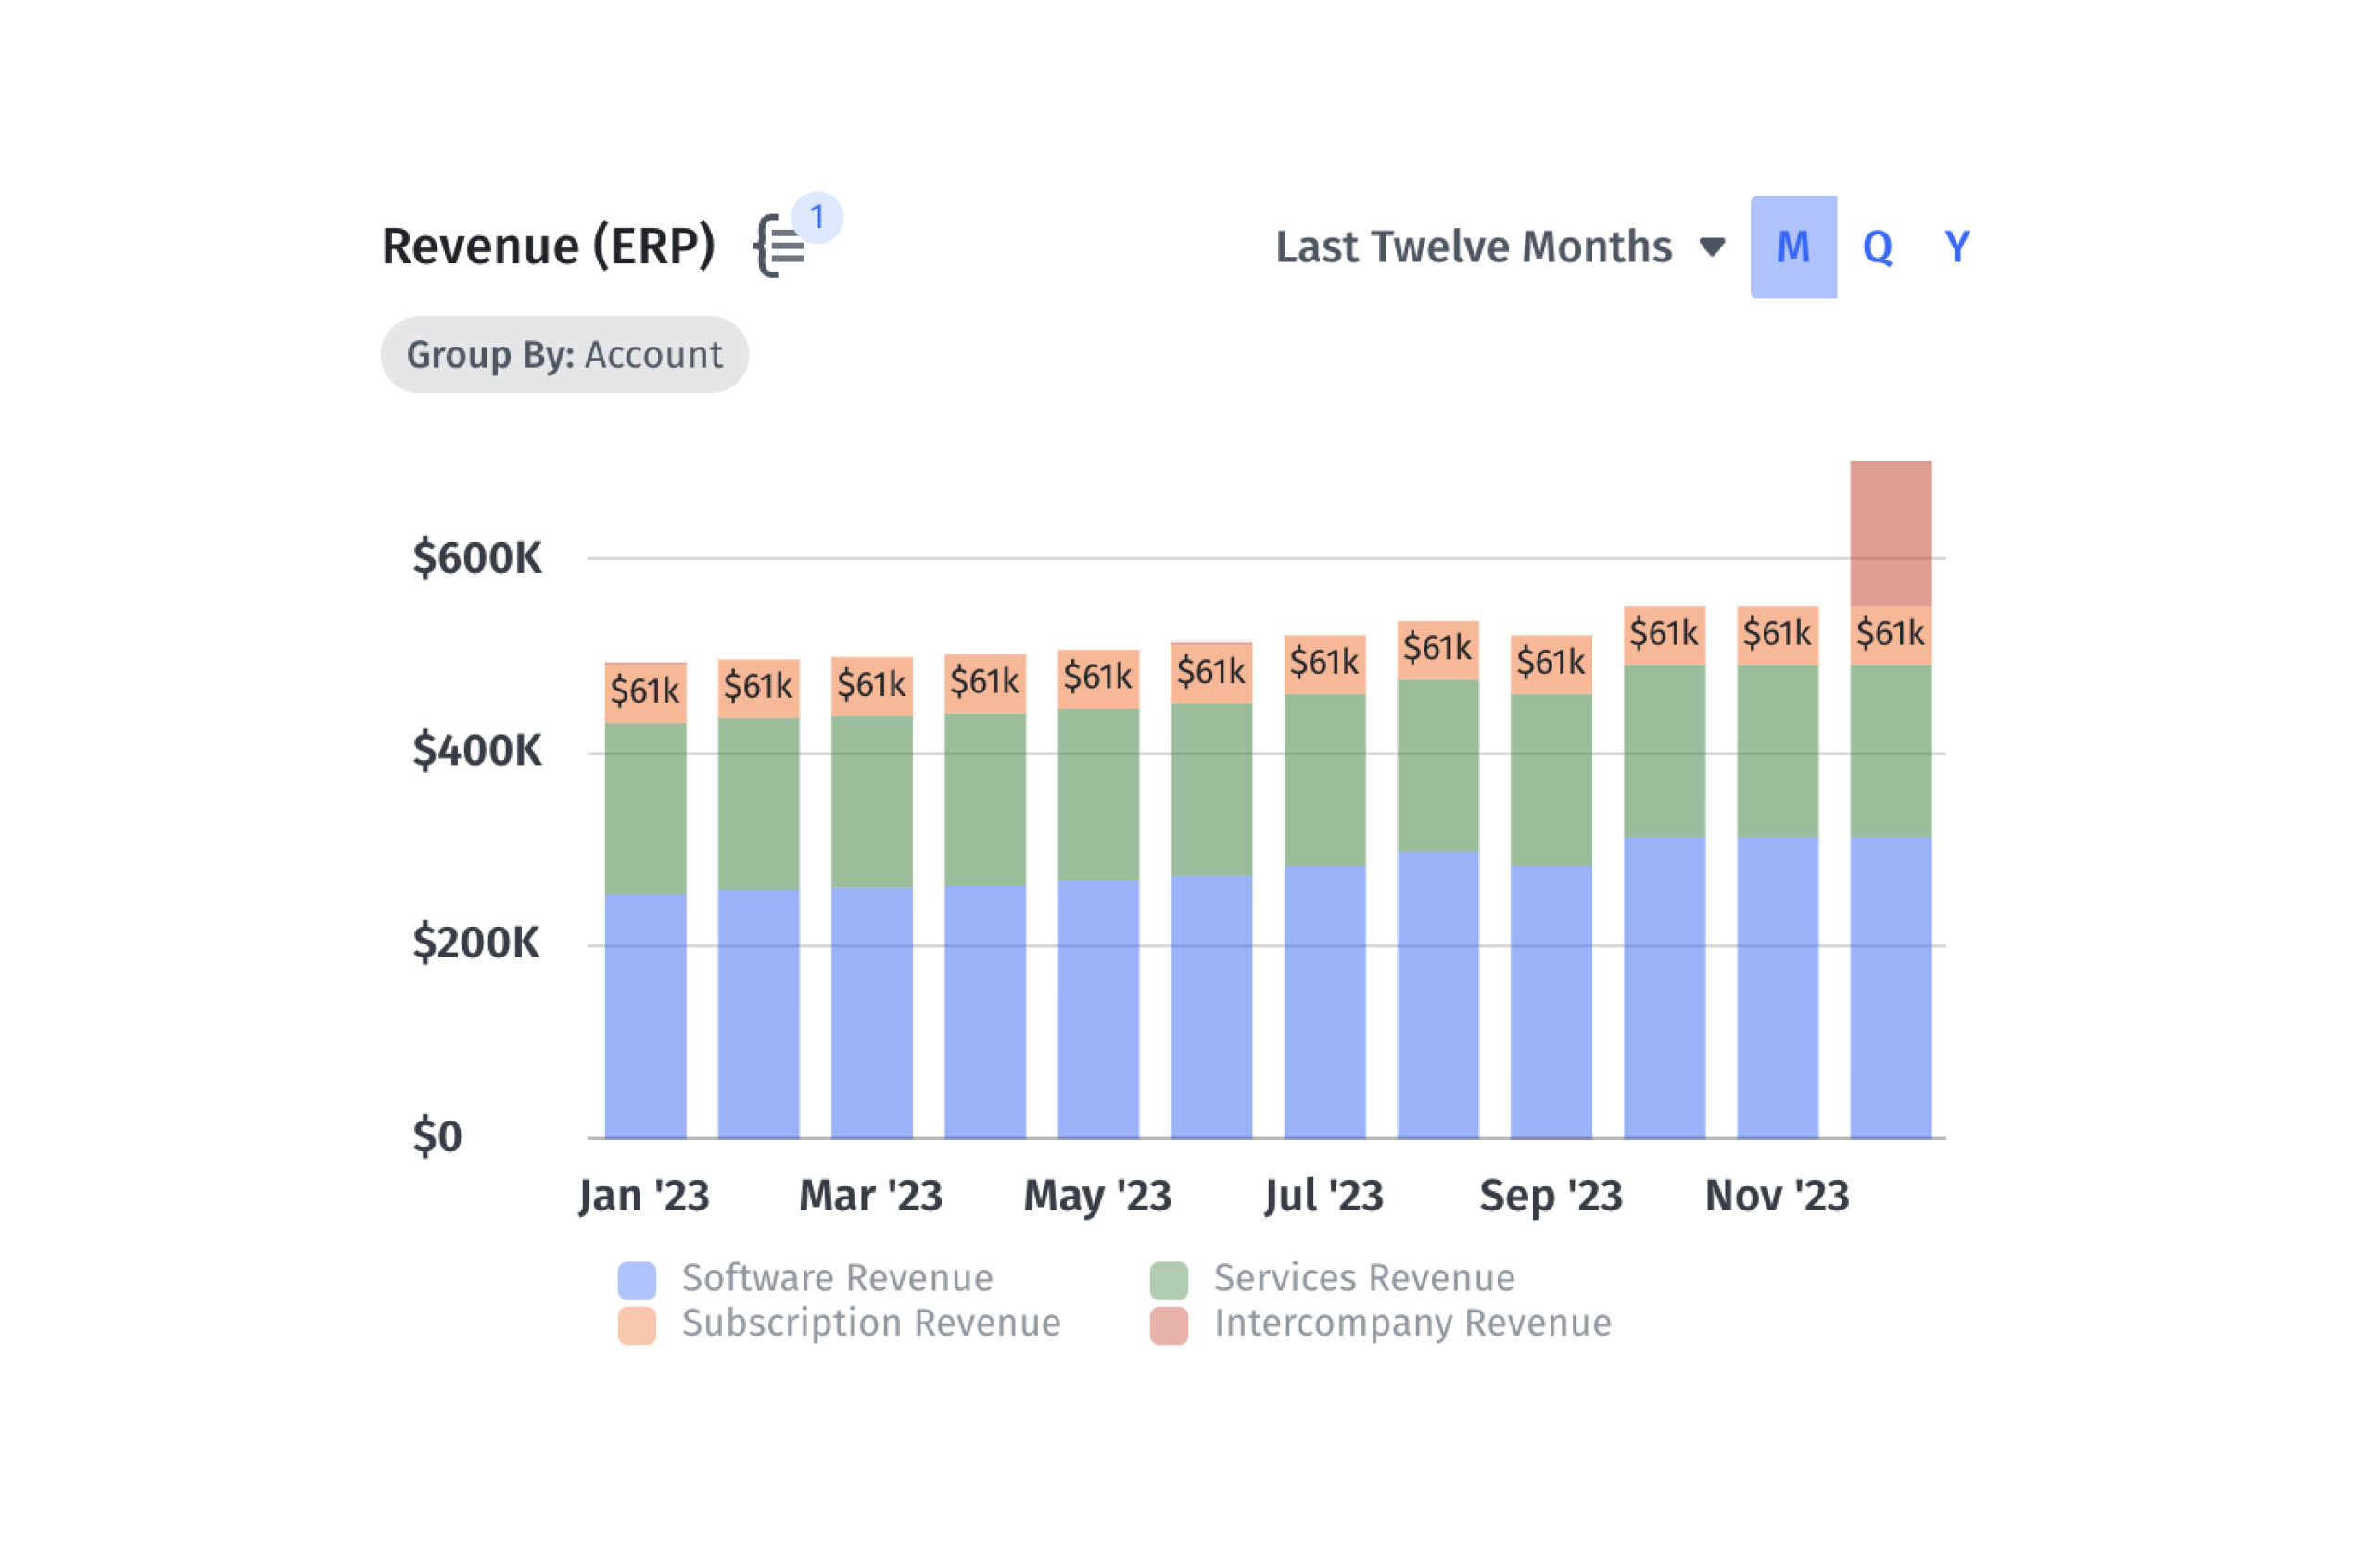
By adding up the total amount of all the money received from customers, total revenue paints a complete picture of a company’s income. This includes subscription revenue, professional services revenue, and any other variable revenue that isn’t a part of recurring revenue.
Categories
Table of Contents
Total Revenue Formula + How to Calculate
Total revenue plays an essential role in your cash flow analysis, as it gives you an insight into the combined income generated by the company for a given period.Total revenue is broadly calculated by adding the company’s monthly recurring revenue (MRR) and accrued revenue if not included in MRR, as well as any other variable income and non-recurring revenue. The formula is as follows:

From a slightly granular perspective, total revenue calculation considers several factors, from cross-sell or upsell revenue and usage-based revenue to professional services and partner-generated income. So, here’s a comprehensive breakdown of the formula:
Total Revenue = MRR + Non-recurring Revenue + Usage-Based Revenue + Upsell/Cross-sell Revenue + Professional Services Revenue + Partner/Affiliate Revenue + Other Revenue
Total Revenue Calculation Example
Let’s consider a hypothetical example to illustrate the calculation of total revenue. Consider a SaaS company with subscription plans, one-time setup fees, and other services.
The company’s MRR for January is $25,000 from 500 customers at $50 per month, one-time setup fees are $500 each for ten customers, usage-based revenue is $1,000, professional services revenue is $2,000 from offering customized training to a client, and other revenue adds up to $3,000 grant from a tech research organization for participation in a study.
Here’s how you might calculate its total revenue for that particular month:
Total Revenue = $25,000 (MRR) + $5,000 (Non-recurring Revenue) + $1,000 (Usage-Based Revenue) + $2,000 (Professional Services Revenue) + $3,000 (Other Revenue) = $36,000
So, in this case, the company’s total revenue for April would be $36,000, representing all the income generated during that specific period.
Factoring Total Revenue Into Your Business Decisions
For anyone in SaaS finance, total revenue is a critical metric that informs decisions on pricing, resource allocation, and product development. It’s integral to financial planning and analysis (FP&A), offering insights into the company’s financial health and influencing critical metrics like customer acquisition cost (CAC), etc.
Understanding your company’s revenue can help you shape effective business strategies and identify growth opportunities. However, all metrics, including total revenue, only hold value in the right context. So, it’s important not to base your business’s future plans on standalone metrics — this could result in poor strategic decisions.
If you want a holistic, comprehensive perspective of business performance, your metrics should be seamlessly integrated into your financial statements and models, a task that’s difficult to achieve with spreadsheets.
A tool like Mosaic integrates directly with your systems of record — including your CRM, HRIS, ERP, billing systems, accounting software, and data warehouses — to track metrics like total revenue in real time. With 150+ out-of-the-box metrics, you can stay on top of financial performance without having to aggregate data manually in spreadsheets.
But if you need to customize calculations and build metrics unique to your business, you can use Mosaic’s Metric Builder. It lets you build custom metrics by leveraging the datasets you integrate from your core source systems.
Beyond Total Revenue: 3 Key Metrics for SaaS Success
Total revenue influences other financial metrics, so it’s important not to look at it in isolation if you want an accurate assessment of a company’s financial health. Below, we suggest three metrics you should monitor alongside total revenue to gain a holistic view of your company’s performance.
1. Monthly Recurring Revenue (MRR)
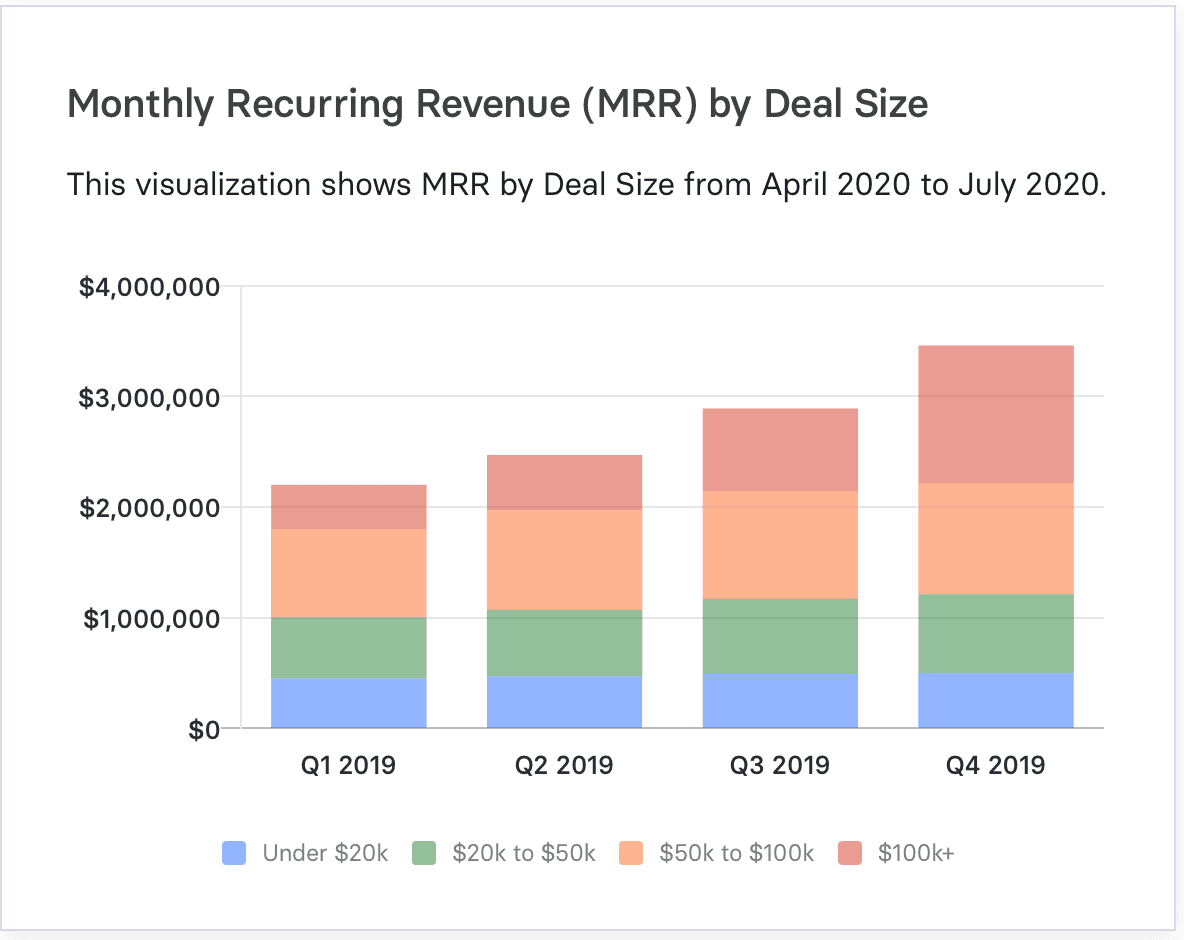
MRR provides a focused view of stable, predictable income from subscriptions and impacts your total revenue calculation, so it’s an essential metric to track.
While total revenue gives a broad picture of all income, including one-time sales or fees, MRR zeroes in on the recurring revenue, helping you understand the company’s financial health, forecast future earnings, and make informed decisions about growth strategies, resource allocation, and investment needs.
However, MRR offers a short-term view of total revenue and insights into your customer base’s momentum. So, while it’s key in helping you understand product-market fit and make immediate investment decisions, as a point-in-time metric, MRR offers more of a snapshot than a full narrative. In other words, it doesn’t predict long-term revenue sustainability and doesn’t account for non-recurring spikes.
As a strategic finance platform, Mosaic integrates with your CRM to calculate your MRR automatically using contract dates. Additionally, it links with your ERP, allowing you to juxtapose your generally accepted accounting principles (GAAP) revenue with your MRR for a clear comparison of the two. Moreover, it monitors any shifts in these metrics, giving you precise insights into the expansion or contraction of each.
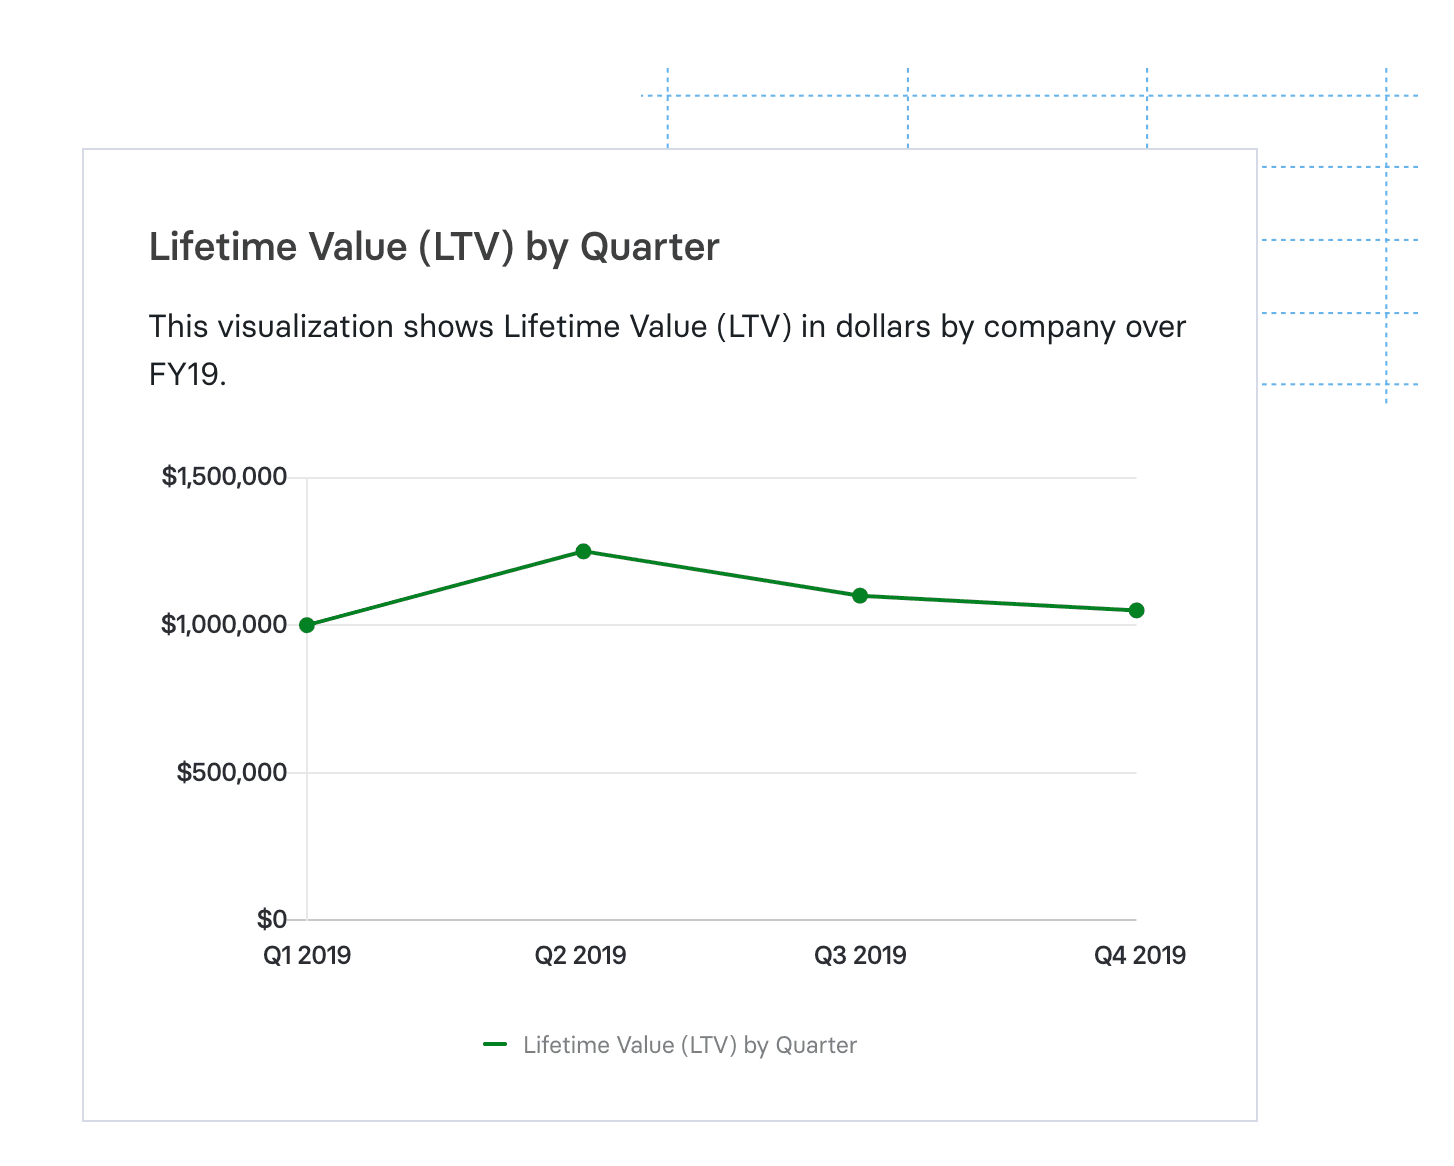
2. Customer Lifetime Value (CLV)
CLV calculates the total revenue a business anticipates from a single customer account throughout the relationship’s duration. It captures the customer’s entire profit potential, considering their subscription’s length and value.
Tracking CLTV alongside total revenue gives you a clear view of long-term profitability and customer relationship value. With this insight, it’s easier to fine-tune your strategies for customer acquisition, retention, and resource distribution based on what’s working (or not working). Moreover, by comparing CLTV with total revenue, you can balance immediate gains against customers’ long-term worth, setting the stage for sustained growth.
Since Mosaic integrates with your CRM, it automatically gathers, standardizes, and determines your customer LTV. It even segments customers by cohort and product line, allowing you to monitor the impact of your total sales revenue and marketing strategies and identify the most lucrative customer paths and milestones. The best part? All this happens in real-time.
3. Churn Rate and Its Impact
Churn rate or customer attrition represents the percentage of customers or revenue lost over a given period. In other words, it measures how many customers stop using a service or how much recurring revenue is lost due to cancellations or downgrades.
Churn rate has an inverse relationship with total revenue, meaning as churn rate increases, it typically signifies a loss of net income and a shrinking customer base that negatively impacts total revenue and your bottom line. On the flip side, customer retention is picking up as the churn rate decreases, leading to a more stable and potentially growing total revenue.
With that in mind, understanding customer retention metrics that affect your company’s profitability is crucial for developing a viable, enduring financial model. Importantly, beyond customer churn, you should monitor KPIs like net revenue and gross revenue retention, gross dollar retention, and lifetime value, among others.
Tracking Revenue Metrics with Mosaic
Unlike spreadsheets and other static systems, Mosaic is a Strategic Finance Platform with specialized features for SaaS businesses. It simplifies financial analysis, top-line planning, and investor or board reporting, among other key finance functions, making the CFO’s work easier while putting financial data at the center of business decisions.
Mosaic simplifies tracking key revenue metrics in real-time, providing a comprehensive view of customer growth, acquisition, and retention on a single platform. It comes preloaded with handy SaaS dashboards, templates, and over 125 out-of-the-box metrics relevant to most SaaS businesses, all ready for immediate use or customization.
For example, Mosaic integrates attrition and retention metrics within its retention dashboard, facilitating quick access to strategic insights for improving customer outcomes.
Take it from MaestroQA, a software company that drives customer loyalty. As the sole member of MaestroQA’s finance and accounting team, Mike Nucci, Director of Operations at MaestroQA, was responsible for monitoring the company’s financial health, conducting budget reviews, and delivering financial insights to the co-founders and board of directors.
However, with the company experiencing rapid revenue growth and the series A funding round approaching, it was crucial that financial planning and analysis (FP&A) did not turn into a constraint.
Luckily, since Mosaic integrates with most ERP, HRIS, CRM, billing, and data warehouse systems, it was easy to implement the platform and hit the ground running. With Mosaic, MaestroQA could maintain its upward growth without needing to add an expensive headcount — or compromise on deep financial insights.
“We’ve saved a significant amount of money over the last three years. If you think about having to hire an accountant and an FP&A specialist, that’s $300,000 per year compared to what we pay for Mosaic. We’re just now hiring a controller, but Mosaic is so good it made it harder for me to make the business case for that hire.”
The Big Picture of Revenue Tracking
While total revenue is undoubtedly crucial in financial planning, it only tells part of the story. For SaaS success, it’s crucial to consider all key metrics together to fully understand the business and make informed, strategic decisions — and Mosaic can help you on this journey.
Request a demo to learn how Mosaic can simplify your financial journey without any heavy lifting.
Total Revenue FAQs
How often should SaaS companies track total revenue?
Generally, SaaS companies should track total revenue monthly to align with recurring billing cycles and quickly respond to changes. However, performing a more detailed quarterly and annual analysis is essential for a more nuanced understanding of growth and performance.
Is total revenue the same as gross profit?
How does Mosaic help in tracking total revenue?
Explore Related Metrics


Own the of your business.
