Average Revenue Formula (ARPU vs. ARPA)
What Is Average Revenue?
Average revenue measures how much revenue your company makes either per unit or per customer account. It’s a non-GAAP measure that helps executives and investors refine their analysis of a company’s revenue generation capability and growth rate at the unit level.
Categories
Average revenue is a crucial SaaS financial metric because it can help you:
- Calculate the number of subscriptions needed to achieve maximum profit
- Identify areas that contribute to losses
- Plan future strategies for scaling your business
That said, there are nuanced differences surrounding the various average revenue formulas.
Let’s dive in to clarify those differences, starting with calculating average revenue.
Table of Contents
Average Revenue Formula + How to Calculate
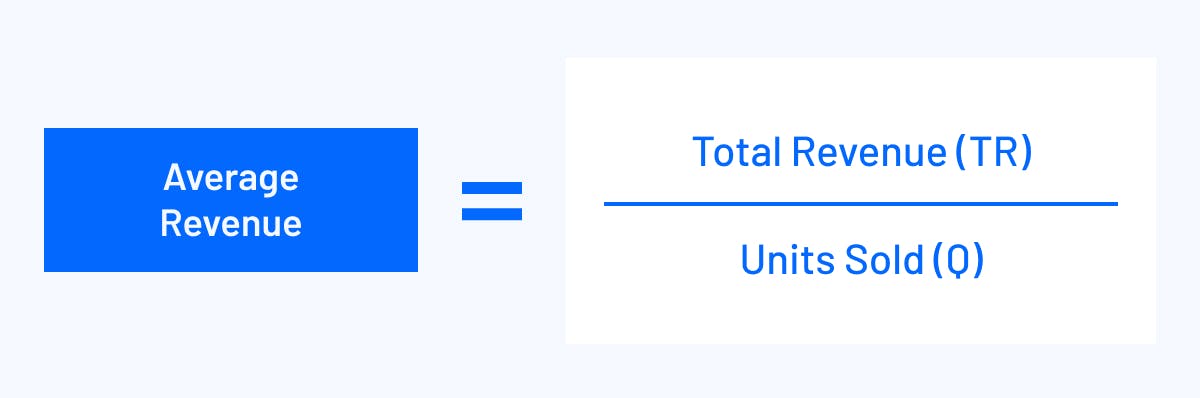
The average revenue formula divides total revenue by the number of units you sell:
Average Revenue Example
Let’s say your company’s total revenue is $20,000, and you’ve sold 2,000 subscription plans for your SaaS product. In that case, your average revenue is:
AR = TR/Q
AR = $20,000 / 2,000 = $10
So, each subscription’s average revenue is $10 per unit.
Get Real-Time Insight Into Revenue Metrics with Mosaic

What Is the Average Revenue per Account (ARPA)?
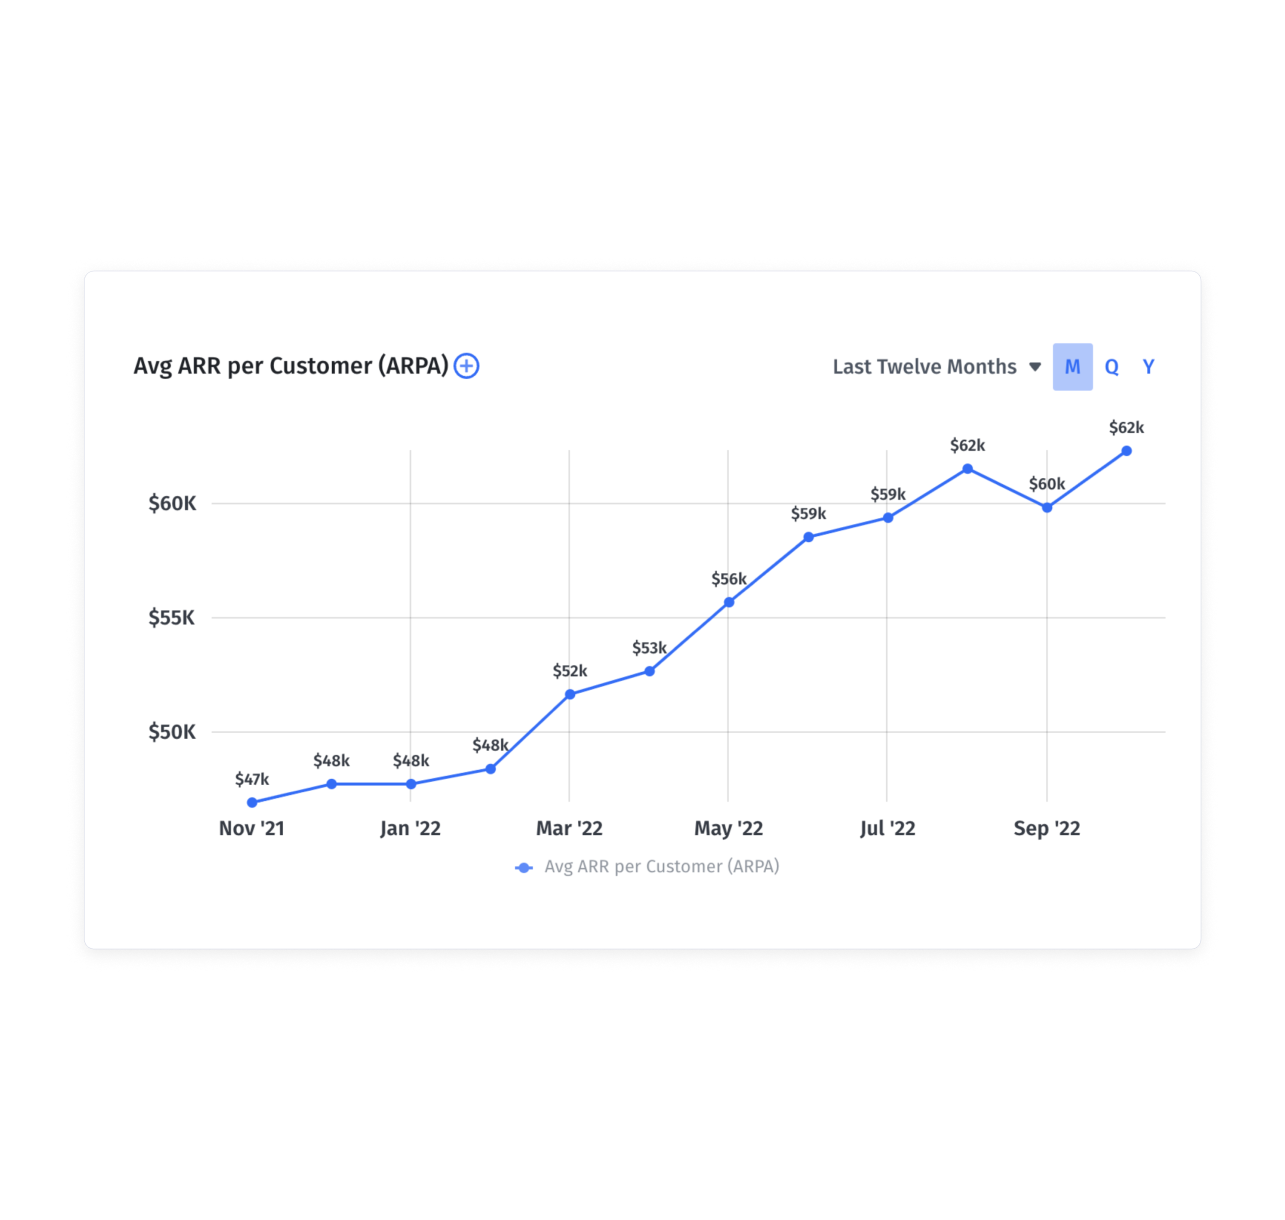
The average revenue per account (ARPA) is a SaaS financial metric that shows how much revenue each customer account generates. It’s usually calculated monthly or yearly.
Subscription-based businesses use ARPA to assess:
- Important financial ratios, such as customer lifetime value (LTV)
- Sales pipeline metrics, such as customer acquisition cost and payback period
- Performance
- Customer segmentation
- Revenue forecasting
- Spend forecasting
How to Calculate ARPA
To calculate ARPA, divide your total revenue in a specific period by the total number of accounts in that same period:

If you want to calculate monthly ARPA, divide the total monthly recurring revenue (MRR) by the total number of accounts in that month:

For example, suppose a SaaS startup has 2,000 active accounts and generates monthly revenue of $200,000. The average revenue per account for that startup would be:
Monthly ARPA = $200,000 / 2,000 = $100 per account per month
Another related metric that can be useful to calculate is average sales price (ASP), which shows you the average revenue generated from new accounts. You can then break this down by region or salesperson for a deeper view into which markets or team members are driving the most revenue.

What Is the Average Revenue per User?
The average revenue per user (ARPU) tracks the amount of revenue you generate per user of the product in a specific time period. Comparing this metric to ARPA helps you understand how well your business is generating revenue as your customer base brings more new users into your product.
How to Calculate Average Revenue per User
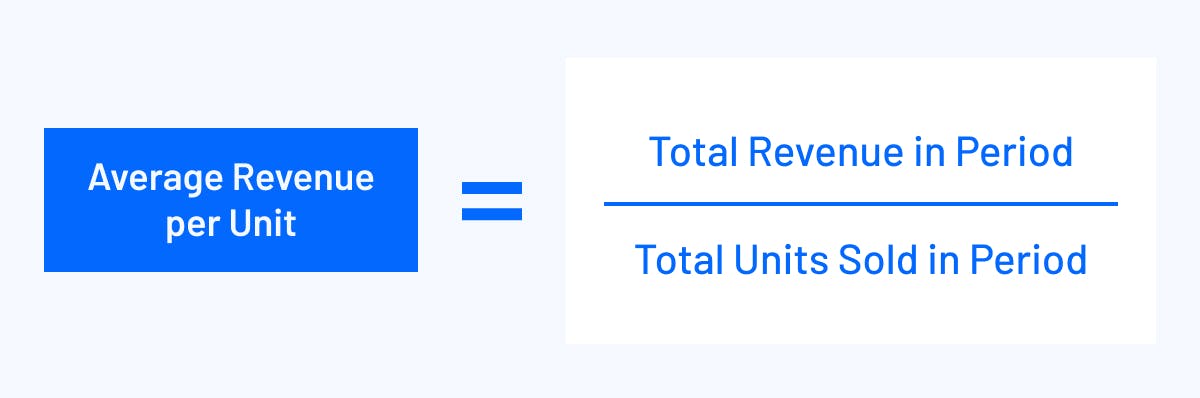
To calculate ARPU, divide the total revenue in a specific period by the total number of users in that same period:

If you want to calculate monthly ARPU, divide the total monthly recurring revenue (MRR) by the total number of users in that month:

Beyond the SaaS industry, telecom companies often use this to track the average revenue generated per mobile phone subscriber per month. It includes the monthly billings to subscribers and revenue generated by incoming calls payable through the regulatory interconnection system.
But in SaaS, this metric is most common for companies that have a seat-based pricing model. You may charge your subscribers a fixed fee to access the platform and an additional rate per user added. Or, you may allow unlimited seats while charging a flat subscription fee. In that case, ARPU could be an interesting metric to understand how user-based revenue compares to account growth.
So, say a website hosting company with 1,000 customers generates $50,000 on a monthly basis. In that case, its average revenue per user would be:
ARPU = $50,000 / 1,000 = $50 per user per month
Other companies use a freemium model, in which case they may want to calculate their ARPU using the total number of paying customers rather than all customers.
What Is Average Revenue per Unit?
The average revenue per user and unit are often used interchangeably. But they have a slight difference.
The average revenue per unit measures the revenue generated from selling one unit of a product. It’s often used by businesses selling tangible products (like ecommerce companies) rather than software or services.
How To Calculate Average Revenue per Unit
You’ll calculate average revenue per unit the same way you calculate the average revenue per user: Divide the total revenue by the total units sold in a given period.
For example, if a game publisher sold 5,000 copies of its games in a month and generated a revenue of $100,000, the average revenue per unit would be:
ARPU = $100,000 / 5,000 = $20 per unit
When To Use ARPA vs. ARPU
In general, whether you focus more on ARPA or ARPU depends on your business model.
For example, if your company doesn’t charge on a per-user basis, ARPU isn’t necessarily a strong indicator of success. Instead, you’d want to track ARPA to better understand trends in your ability to drive revenue growth through expansion revenue.
In contrast, a company with more variable pricing based on seats will want to use ARPU to better understand the ROI of adding more active users to the platform.
Track ARPA With Mosaic
Tracking ARPA and other SaaS financial metrics like revenue run rate can be tedious. Managing all the spreadsheets and updating data points on a regular basis can easily eat into your productivity.
Instead, Mosaic can help capture essential metrics by streamlining data from your company’s ERP and CRM systems.

Syncing your existing software with your Mosaic account automatically pulls in and updates the data in real time. This eliminates the need to get data from multiple sources and calculate formulas.
As a result, you can understand the cash flow and expense trends down to the department level.
Request a demo to learn more about how Mosaic can help you track your ARPA, CAC, LTV, and other financial metrics easily.
Average Revenue FAQs
What is the difference between average revenue and marginal revenue?
Average revenue is simply the measure of revenue earned per account or user over a given time period. Marginal revenue is more complicated, providing a modeled view of how much revenue can be expected per additional unit sold over time and at scale. It’s more of an economic concept to convey the impact of different prices and changes in demand.
What is a good ARPU?
What is a good ARPA?
What is the difference between ARPU and LTV?
Explore Related Metrics


Own the of your business.
