Categories
Table of Contents
Strategic business decisions rely on in-depth, high-quality data — and the sooner you can access and analyze that data, the sooner forward-looking strategies impact the company. But to uncover the kinds of insights your business needs, you need the resources and time to pull and analyze the right data.
Mosaic’s 2022 SaaS Performance Reporting Benchmarks study discovered that only 14% of surveyed finance leaders use cohort analysis for retention data — one of the many measures that lead to deeper strategic insights.
Why? In an episode of The Role Forward podcast, Steve Groccia, Head of Customer Operations at Mosaic and former Head of Finance at Fundbox, emphasized that customer cohort analysis takes more time than you think. “It takes a lot of time, resources, and energy to just set up the data in a way that would actually make it usable and make it work,” Groccia said.
It’s not easy, but cohort analysis is crucial to going from just reporting on your numbers to explaining the “why” behind them. Here’s how you can get the most out of your customer cohort data.
What Is Customer Cohort Analysis?
Customer cohort analysis (or user cohort analysis) is a process that provides insight into what works best to engage, convert, and retain customers. By analyzing similar customers or groups of users through common characteristics, such as segmenting via company size or time frame (like acquisition date), finance can then deliver insights on customer lifetime value (LTV), net revenue retention, churn rate, and overall company growth.
Types of Customer Cohort Analysis
There are two types of cohort analysis: segment-based and time-based. Depending on what financial metric you want to dive deeper into, one may be optimal over the other.
Segment-Based Cohort Analysis
Segment-based cohort analysis produces what Groccia refers to as a “colorful layer cake graph.” If you were to look at your annual recurring revenue (ARR) and segment ARR by different cohorts per year, each year produces a different layer that tells you how much each customer provides in revenue.
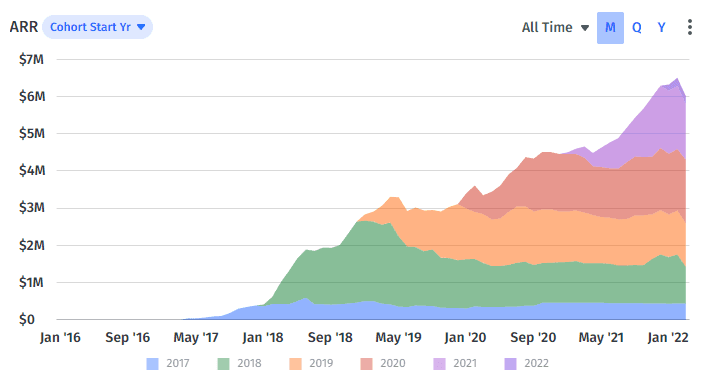
“You want a lot of layers,” said Groccia. “That means you have a ton of existing customers using your product, but you still want that top layer [the most recent year] to be really high because you want to keep growing — and keep growing fast.”
Time-Based Cohort Analysis
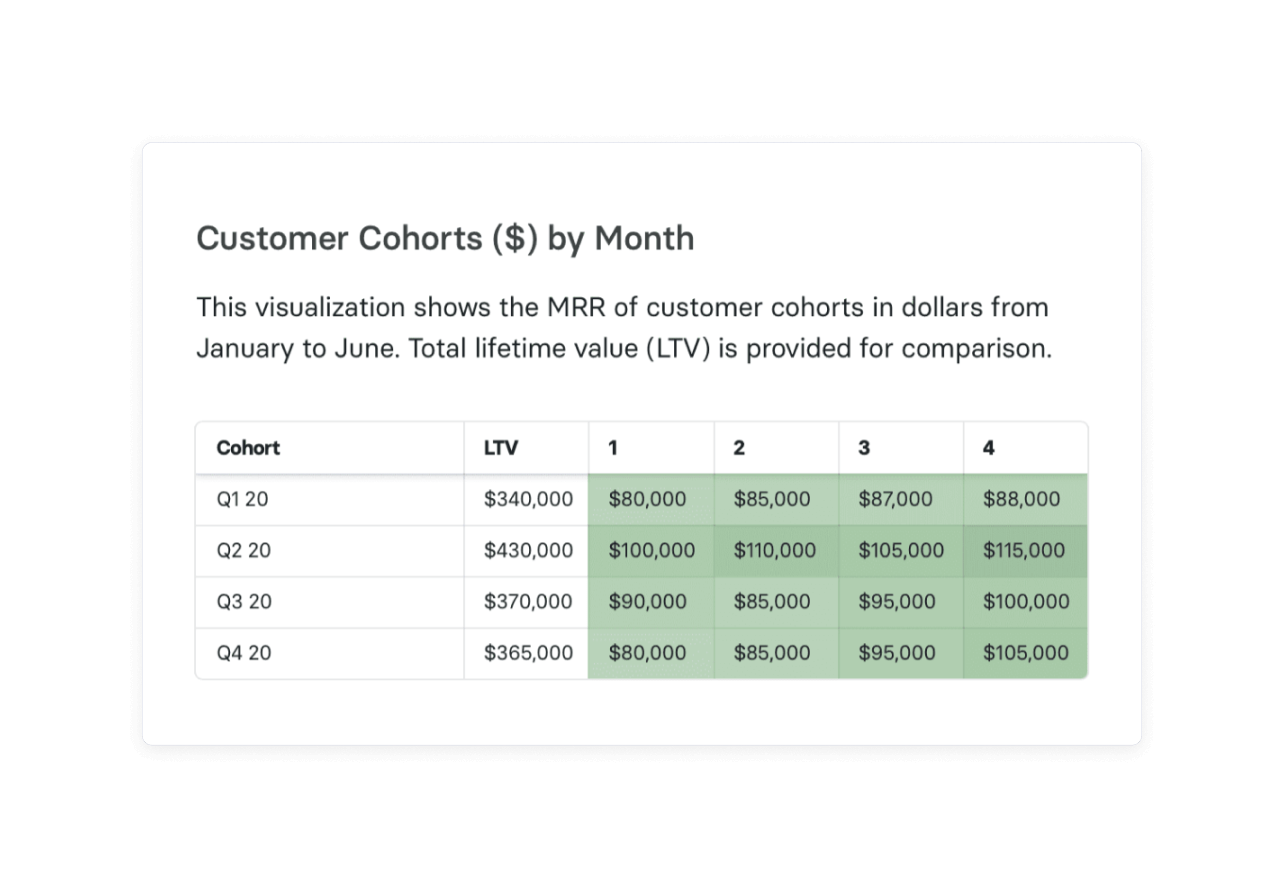
Time-based cohort analysis is “the classic” version of cohorting. You’ll see a waterfall along your X-axis, while the Y-axis has some sort of segmentation to dive deeper into NRR and customer lifecycle over a specific period of time.
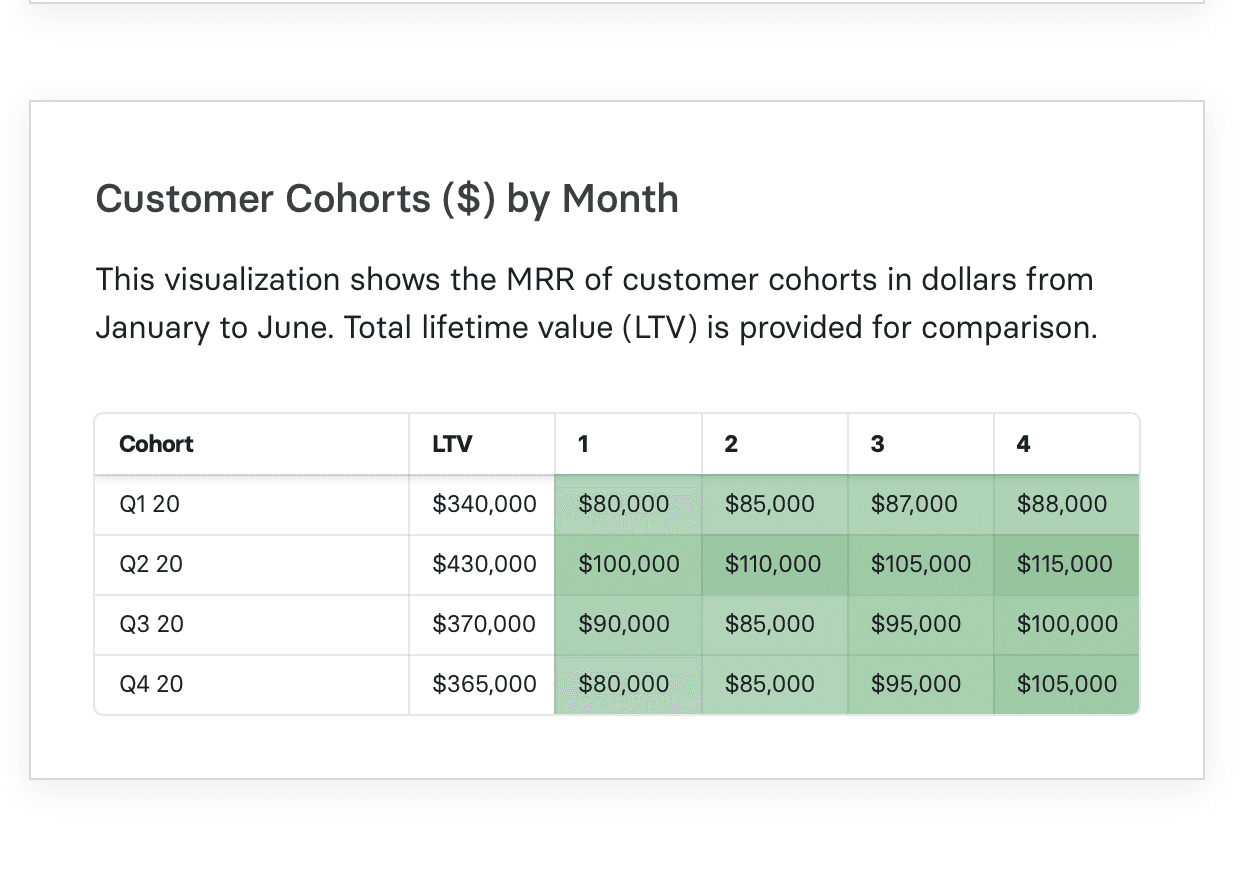
You want to analyze user behavior to see what works and what doesn’t work. You’ll point customer success and sales toward the numbers and dips in your observations, which will lead to strong collaboration that answers questions like “Where do customers begin to downgrade or churn?” and “Where do customers discover the most value of the product — and how can we get them to value it sooner?”
Churn Analysis vs. Customer Cohort Analysis
In the most basic sense, churn analysis and customer cohort analysis have the same goal — to give you insight into how well you’re retaining customers. Think about the difference in terms of depth of insight.
Your churn analysis provides a number that finance needs to know inside and out. “It’s table stakes just to know where you land, relative to other companies of your size. But to really understand the dynamics of it, that’s where cohorting becomes very powerful because you could actually start to understand the ‘why’ behind your numbers,” said Groccia.
You can apply cohort analysis to your NRR data to get a clear view of how you’re tracking toward the 120% revenue retention benchmark for SaaS companies. Segmenting the data with cohorts helps you understand retention across different product lines, account sizes, and support tiers.
Digging into customer cohort analysis for retention metrics like NRR and LTV provides further insight into the customer journey for the marketing, sales, and customer success teams. They’ll discover if they need to revise their ideal customer profile (ICPs), where customers begin to pay back their customer acquisition cost (CAC), and overall customer satisfaction.
Get The 10 SaaS Metrics You Didn’t Know You Needed

How SaaS Companies Can Use Customer Cohort Analysis
Customer cohort analysis provides that deeper insight into data. While it’s an incredibly valuable metric to track, sometimes you run into situations where you’re almost spinning your wheels trying to find something that’s just not there. The following use cases empower you to take two steps back to deeply think through what you’re trying to solve and how your findings create a strategic impact on the company’s growth goals.
Reveal Customer Churn Patterns
The user cohort analysis focuses on customer behavior — and as retention’s inverse, you can trend user behavior around churn. Say you aggregate a cohort based on new users who signed up with a certain level of support. You notice that they begin to drop off around the four-month mark. This could reveal potential issues with either onboarding the product or service tier misalignment.
Report these findings to the customer service, product, and sales departments. While customer service keeps a closer eye on the onboarding and support processes, engineers on the product side can work through any feedback on missing or underperforming features’ functionality. Sales can keep track of matching services to customers to ensure alignment and proper product/market fit.
Drive Growth in Renewal Cycles
Your retention metrics (NRR, gross dollar retention, and ARR) are prime for segmenting by customer cohort. Not only will your customer cohort analysis identify behavioral patterns, but it’ll also tell you about the user experience overall.
“From a SaaS perspective, the stickier you can make the product, the better for the long-term viability of the business,” said Groccia. Segmenting your data allows you to see that stickiness, whether it’s behavior around renewals, upsells, or overall retention.
Groccia emphasized that a cohort analysis provides the inflection points for when customers get the most value out of a product or when their usage goes down. By identifying these patterns, finance provides insight so customer success can create proactive solutions that move a customer account from “potential downgrade” to “upsold.”
Analyze Your Pricing Strategy
Retention is one thing, but when customers are stagnant or declining in terms of bringing revenue to your business, something needs to change. If customers are between 90% and 110% NRR after their first year or two, you need to reconsider your pricing strategy.
Your SaaS pricing strategy must be set to optimize scaling revenue and maximizing LTV over time while being an accurate price for new customers to see the value of your product quickly. Take a cue from Fivetran, who realized their subscription-based pricing model didn’t align with their consumption-based-priced competitors.
Fivetran now offers a per-credit, usage-based model — which they wouldn’t have reached had they not embraced understanding the “why” behind the numbers and collaborating across the company to ensure pricing aligned with customers’ current and future needs.
Get Deeper Insight Into Cohort Performance & Analysis

How Revenue.io Leveraged Customer Cohort Analysis to Fuel Their Product Line Growth Strategy
AI-powered RevOps platform Revenue.io’s growth strategy was to onboard customers through one main product (RingDNA), then methodically cross-sell other product lines throughout the relationship.
But to get there, Revenue.io needed to understand customer profiles and behavior to ensure the right product/market fit per profile. After spending hours per week building 12 separate reports, then calculating 30+ business-critical metrics in Excel, Revenue.io came to Mosaic to refine their processes.
Once Revenue.io integrated Mosaic with Salesforce and their CRM, the finance team turned their 12 separate reports into 12 self-serve dashboards that update in real-time. This move saved them over 32 hours per month.
As the number of customers and products grew, we were tasked with finding a way to scale our workflows, analyze new business, and expand revenue against our existing base. This puts pressure on finance to find faster ways to deliver insights in support of our vision.
With pre-loaded metrics, graphs, and templates, Mosaic provided Revenue.io the ability to build a financial intelligence layer over Salesforce to automate the manual work that went into calculating metrics in Excel and pulling multiple reports. And with each dashboard updated in real-time, finance keeps an eye on customer behavior and can communicate any dips with plenty of time for sales and customer success to strategize on how to ensure a positive customer experience from beginning to end and keep sales and customer success KPIs strong.
Get Customer Cohort Analyses in Minutes with Mosaic
Conducting your cohort analysis in Excel takes hours to complete and is susceptible to manual errors through various data segmentation and manipulation. Diving deeper into your user cohort analysis report presents the conundrum of potential bias: You may consider one cohort a priority over another, which hurts the objectivity and wider view of the business at large.
Mosaic gives time back to the finance team through its automation and pre-loaded data visualization tools and metrics, which helps to restore an objective baseline to consider all levels of customer behavior at any time.
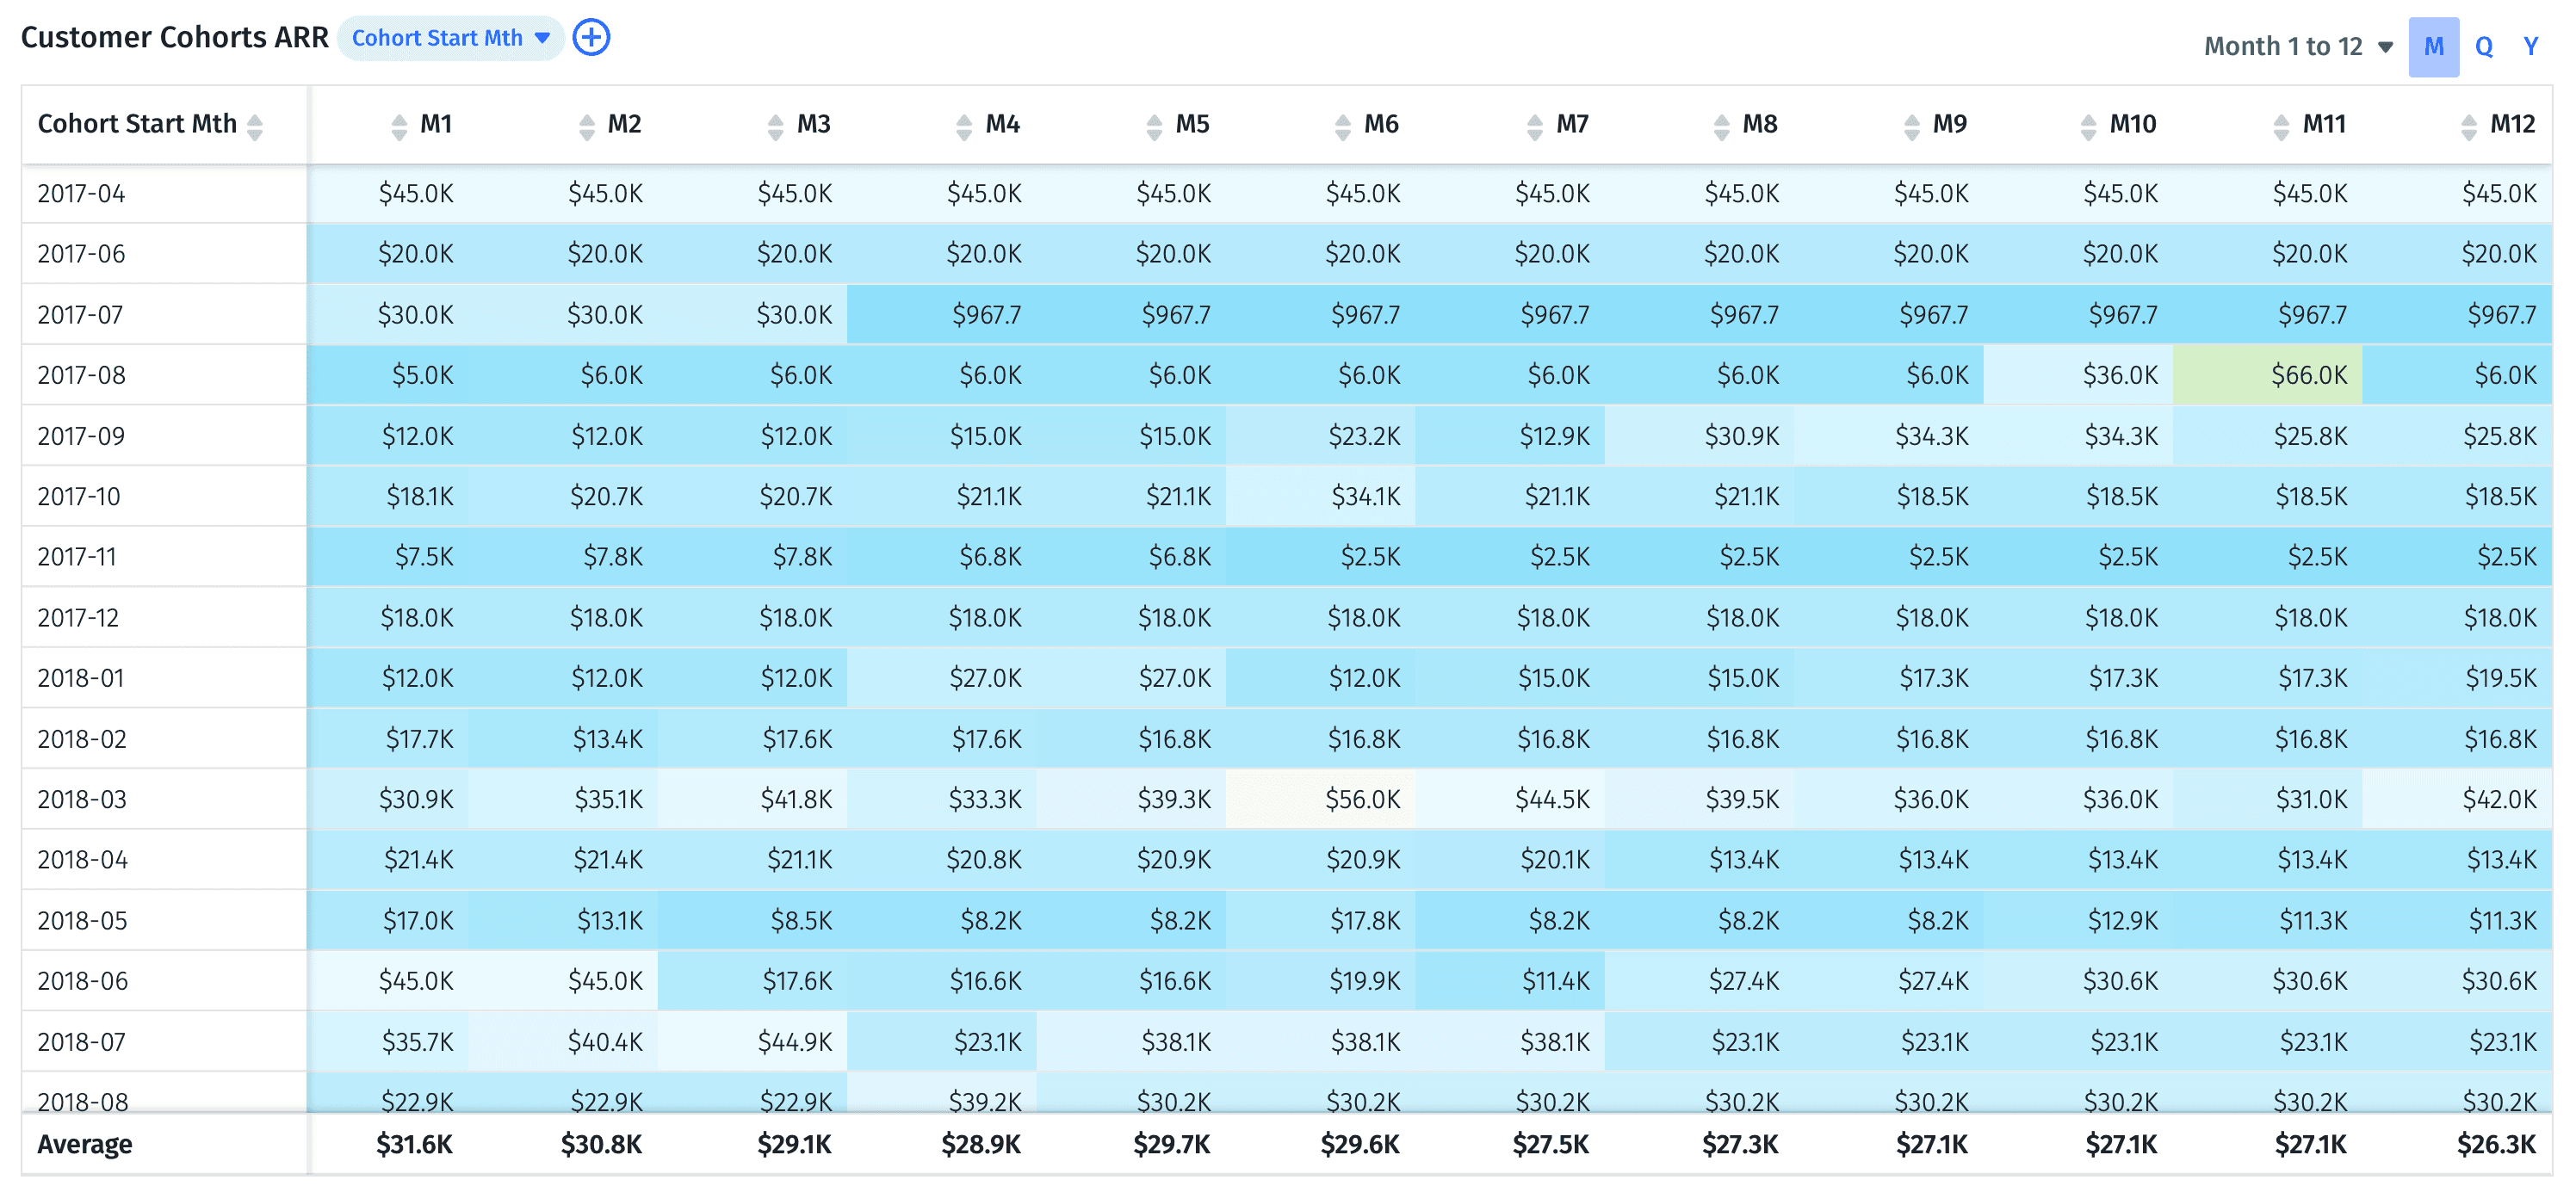
Mosaic’s baseline views for cohort analysis are:
- Customer cohorts by average ARR
- Customer cohorts by net dollar retention percentage
- Customer cohort percent retention by ARR
Once you set up your baseline, you can then dive deeper into the data by assigning attributes, such as industry, number of employees, product line, and support tier. At this level of granularity, you discover what’s going well and how to improve your customer retention rate, upsell strategies, and overall business growth.
With Mosaic, collaboration becomes much easier, as the layout can change from numbers to colorful graphs with a click of a mouse. This is what Groccia considers the “fun part of finance,” where finance discovers opportunities to “move the needle on customer behavior,” presents their findings to the marketing and retention teams, and collaborates on actionable insights that have a massive impact on the customer base.
Saving time while getting deeper insight into your financial data and behavioral analytics is a win-win for everyone. Allow your customer behavior to speak volumes through agile customer cohort analysis reporting, customer retention analysis, and forecasting — request a personalized demo of Mosaic today.
Customer Cohort Analysis FAQs
What are examples of customer cohorts?
Customer cohorts are a way to segment a group of customers based on shared characteristics within this group of accounts. Specific cohorts, for example, include acquisition cohorts based on the date of the conversion, and behavioral cohorts, which can, for example, group your most active users into a demographic.
Why is cohort analysis important?
What are the two types of cohort analysis?
What are the benefits of customer cohort analysis?
Explore Related Metrics


Own the of your business.
