Pipeline Coverage Ratio
What is Pipeline Coverage Ratio?
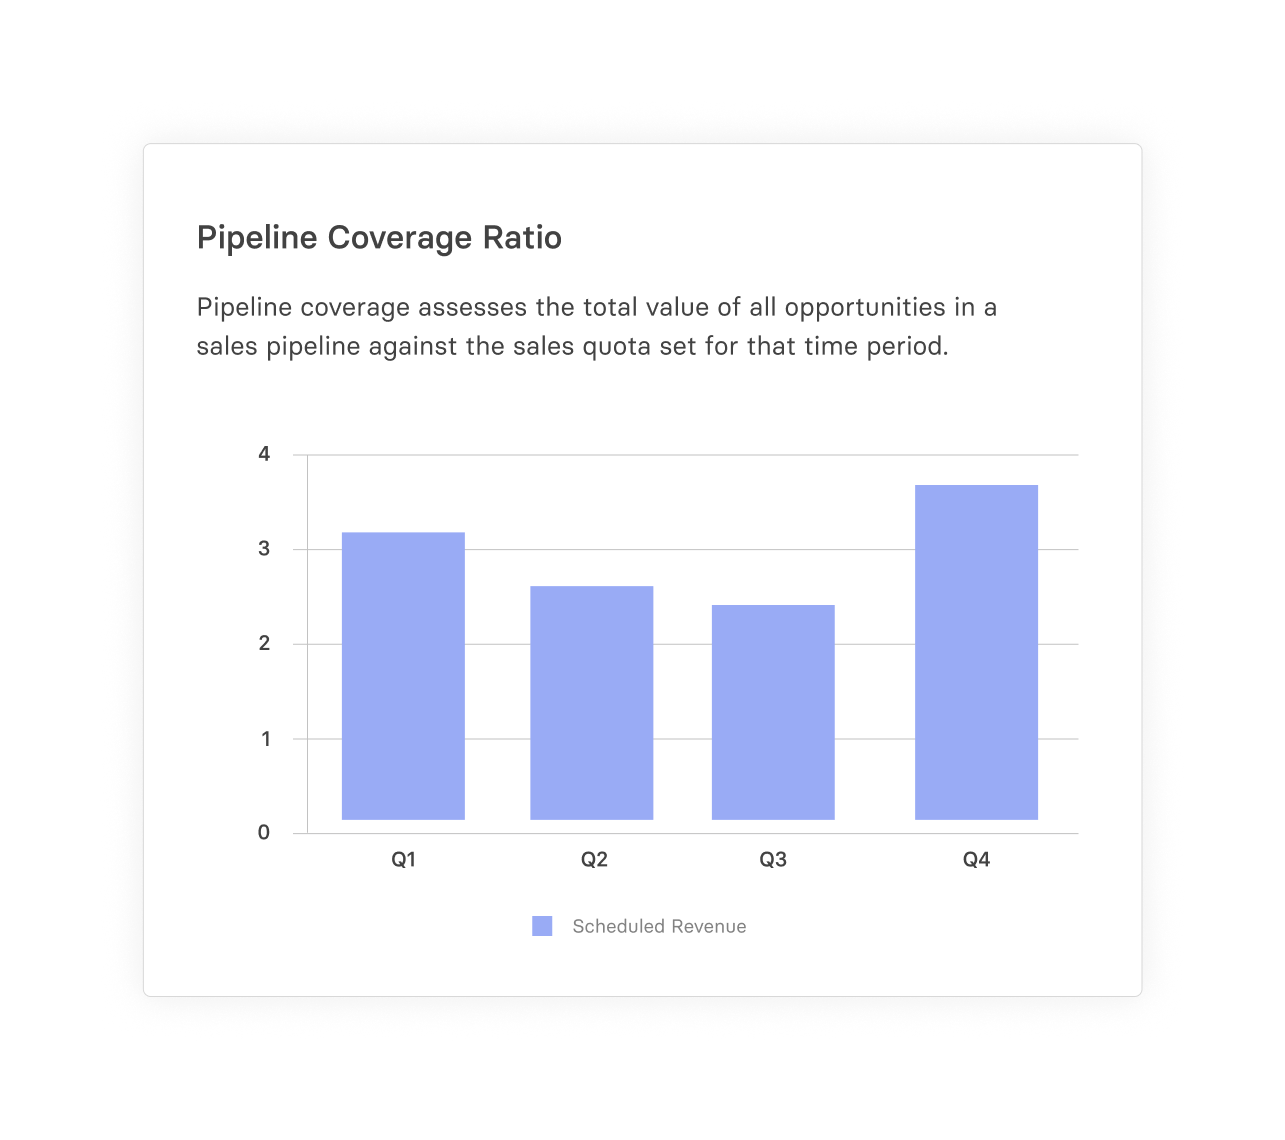
The pipeline coverage ratio compares the value of your current sales pipeline to your sales quotas or goals for a certain period of time. It’s a financial metric that reflects a business’s health and future success potential. You calculate it by dividing the total value of opportunities in the sales pipeline by the sales target for a certain time period. For instance, if Q1 2024’s pipeline is worth $300,000 and the target is $100,000, the ratio is 3:1—this shows a healthy pipeline with three times the potential sales needed to meet the target.
Categories
Table of Contents
Importance of Pipeline Coverage Ratio in Sales Forecasting
The pipeline coverage ratio gives insights into the company’s revenue potential and helps you set realistic targets. More importantly, it tells you whether the business is healthy enough to meet its future targets or is in danger of falling short.
So, think of it as a quantifiable measure of whether you’ve got enough sales opportunities or leads lined up to meet your sales or revenue goals — it impacts sales forecasting and, by extension, revenue forecasting and revenue planning, as every variable can impact the company’s financial stability.
That said, the pipeline coverage ratio isn’t just a metric that finance folks and sales reps care about — it’s central to a SaaS company’s marketing strategy. Here’s why: While sales might close the deals, marketing lays the groundwork, attracting leads and filling the sales pipeline. In other words, a solid marketing strategy is absolutely key in keeping the pipeline healthy, ensuring the sales team has a constant stream of opportunities to work on.
How Much Pipeline Coverage Do SaaS Companies Need?
There isn’t a one-size-fits-all benchmark for this metric. However, typically, the ideal pipeline coverage ratio for SaaS companies hovers around 3:1 or better, suggesting that potential revenue is three times the target you’re aiming for. This cushion is invaluable, as there’s peace of mind that even if some deals fall through, you’re still set to achieve your revenue objectives.
But gaining these insights or achieving your sales and revenue targets isn’t a one-and-done task. To leverage this metric effectively, you’ll have to continuously set targets, monitor sales performance, and adjust your sales or marketing strategies for the next quarter or month based on what you find — be it quarter-to-quarter or month-to-month.
This way, every marketing or sales initiative strategically aligns with where you want your business to go (and contributes to exceeding revenue expectations).
Calculating the Pipeline Coverage Ratio (Formula + Example)
Calculating the pipeline coverage ratio is straightforward. You can find out the ratio by dividing the total value of the sales pipeline by the sales target for a given period. Here’s how that would look as a formula:

For example, let’s say your total sales pipeline is valued at $800,000, and your sales target for the quarter is $200,000. In this case, your pipeline coverage ratio would be:
Pipeline Coverage Ratio for Q1 = $800,000 / $200,000 = 4:1
Essentially, this means you have four times the potential revenue in your pipeline compared to your sales target, which is impressive as it means you have a substantial buffer. So, the company will likely exceed sales goals even if many of these deals in the pipeline don’t pan out.
However, if you’re calculating the pipeline coverage ratio in Excel, remember that spreadsheets and manual calculations are incredibly time-consuming and error-prone — and mistakes resulting from using Excel spreadsheets can cost organizations a hefty amount in losses.
Luckily, this is where Mosaic’s Metric Builder shines. Mosaic pulls all your data from your HRIS, CRM, ERP, billing system, or flat file upload into one platform in real-time, letting you work off a single source of truth.
Metric Builder not only comes with 150+ out-of-the-box SaaS financial metrics but also lets you build custom metrics, like pipeline coverage ratio, making it easy for you to monitor progress and make informed decisions continuously.
Factors Influencing the Ratio
As we previously mentioned, calculating the pipeline coverage ratio isn’t a one-off task. You’d have to frequently monitor this metric to track progress (or deviations) so you can pivot your marketing and sales strategy accordingly.
As you know, in business, things can change at any time — anticipated deals may not always work out, market or economic conditions might shift due to inflation or recession, or you might see new entrants in the market, i.e., more competition.
Moreover, your sales and marketing strategy directly influence your pipeline’s value and, consequently, the pipeline coverage ratio. So, if your average sales cycle is too long or these teams are not working with an effective strategy that meets potential customers where they’re at, you might miss out on these deals, which essentially impacts the closing rate or win rate.
Another reason your ratio might change is if your product offerings have evolved. Pricing or feature changes can positively impact the pipeline by attracting more prospects or affecting deal sizes. On the flip side, a sudden price change may deter previously qualified leads if it’s too high.
All these cases highlight the importance of keeping a close eye on your pipeline coverage ratio and making informed decisions to steer your company toward its sales targets.
4 Best Practices for Managing Pipeline Coverage
Improving your pipeline coverage ratio is about strategically setting goals, streamlining your sales process, and leveraging marketing to fuel growth. Below, we’ve shared three best practices to help you take control of this metric:
1. Set Realistic Sales Targets
First, setting yourself (and sales) up for success is important. So, focus on setting achievable sales targets by analyzing your historical data, considering industry benchmarks, and assessing current market conditions — this will also help you gauge where your company falls next to competitors or past performance.
Additionally, you should aim for sales targets that push the team to grow without overwhelming them. Finding the right balance will keep the sales team motivated and align sales goals with the volume and quality of the pipeline.
2. Improve Sales Pipeline Efficiency
When building out marketing and sales strategies, don’t just focus on adding more leads — make sure the sales pipeline moves leads to prospects more efficiently.
For instance, refine the lead qualification process to ensure your team focuses on deals with high potential, as this can boost the pipeline coverage ratio. Also, look for bottlenecks or drop-offs in various pipeline stages and tackle them head-on.
Ultimately, the smoother your leads flow through your pipeline, the better your coverage ratio will be.
3. Prioritize Marketing’s Role in Pipeline Generation
Don’t overlook the marketing team’s role in significantly boosting your sales pipeline. Ensure alignment between marketing strategies and sales objectives to attract the company’s ideal customers.
Leverage data to continuously refine marketing tactics through content marketing, digital advertising, or events to build a quality list of leads in the pipeline. If these convert, it helps you achieve sales targets, improving the pipeline coverage ratio.
4. Focus on Building Pipeline through several channels
Marketing is one source of pipeline generation. Partnerships can be another as well as a well constructed business development team sending cold emails and making cold calls can greatly improve your pipeline generation which gives you the coverage you need.
Track Pipeline Coverage in Mosaic
Navigating your pipeline coverage ratio doesn’t have to be a daunting task. With Mosaic, you’ll go beyond tracking numbers — you can unlock a more intuitive way to analyze and understand your metrics, including the pipeline coverage ratio.
Although the pipeline coverage ratio isn’t one of Mosaic’s 150+ out-of-the-box SaaS metrics, it’s easy to get a view of all of your key sales funnel metrics with Metric Builder.
Metric Builder is designed to seamlessly pull together sales data from your CRM, such as Hubspot or Salesforce, and juxtapose it with your revenue goals. So, you can drill down into your pipeline actuals and effortlessly compare those figures against your set targets.
And Mosaic’s benefits don’t end there. With Mosaic, you can:
- Leverage intuitive formulas with auto-complete features
- Enjoy the familiarity of Excel without the hassle with sheet-like formatting
- Dive deeper into your forecasting with metric cross-referencing
- Test different assumptions with ease with simple scenario planning
- Set up and track goals quickly and efficiently — it’s literally just one click away with Mosaic’s Analysis Canvas dashboard
- Use premade templates and sales dashboards to get the right insights at the right time
Take it from Botpress, a leading open-source chatbot platform that saw greater financial visibility and shortened close cycles by 87% — all thanks to Mosaic.
“Mosaic gives us the metrics we need, even down to what’s required for an audit.”
Leveraging Pipeline Coverage Ratio for Strategic Success
The pipeline coverage ratio is meant to help you thoughtfully steer your SaaS business toward sustainable growth and success. By effectively calculating, monitoring, and acting on this metric, you can set realistic sales targets, optimize your sales and marketing efforts, and achieve your company’s financial goals more accurately.
Thanks to Mosaic, calculating and tracking metrics has never been more straightforward. To learn how Mosaic can help you get better visibility into your financial data, request a personalized demo.
Pipeline Coverage Ratio FAQs
What is a good pipeline coverage ratio?
A good pipeline coverage ratio typically falls within the range of 3:1 to 4:1. This ratio indicates that the potential sales volume is three to four times the sales target, which is a healthy buffer for achieving sales goals.
How often should the pipeline coverage ratio be calculated?
Can the pipeline coverage ratio predict sales success?
Explore Related Metrics


Own the of your business.
