

A functional CFO dashboard is the ticket to catching problems before they occur, putting finance teams on the offensive rather than relegating them to a defensive position where even the best reactive solutions take weeks to resolve a totally preventable issue. With the right dashboards, you get the right information at your fingertips and the business intelligence functionality needed to translate them into insights stakeholders can take advantage of.
In short, a proper CFO dashboard should make it easy to guide a business into the stratosphere. So let’s go over all the nitty details that make up a great CFO dashboard. Then we’ll earmark a few of our favorite dashboard setups around.
Table of Contents
What Is a CFO Dashboard?
The CFO financial dashboard aggregates financial KPIs and provides intuitive tools to organize, analyze, and share information about a company’s financial health. The purpose of a CFO dashboard is to provide at-a-glance visibility into critical metrics and an interactive workspace to uncover actionable insights that drive strategic decision-making. But not all dashboards are created equal.
A great CFO dashboard offers panoramic views of a business’s financial performance, past, present, and projectable future. With it, you should be able to generate financial reports and disseminate them to the whole team in a matter of minutes. To make that possible, your dashboard should cover three requirements. It should:
- Run off of real-time data through integrations with key source systems
- Be flexible enough to alter the time period and drill-down settings so you can answer ad hoc questions
- Grow with your business as it matures by providing access to more advanced metrics

14 Most Important Metrics to Include in Your CFO Dashboards
The best interactive dashboards allow users to choose which key metrics they want to see and how to present that financial information. Below are some common and useful key performance indicators to include in your dashboard.
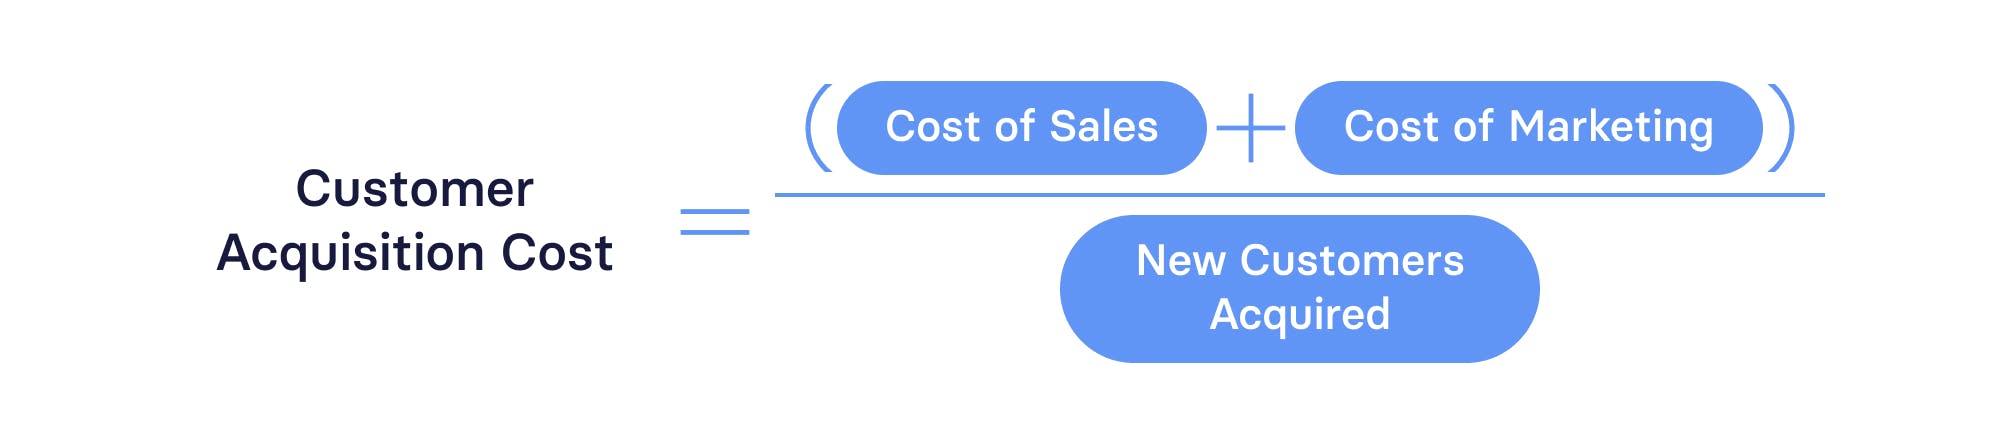
Customer Acquisition Cost (CAC)
Customer acquisition cost is the cost of turning a prospective buyer into a new customer. It measures the effectiveness of your marketing and sales efforts to attract, nurture, and convert leads. A good CAC signals to investors that you know how to grow efficiently.
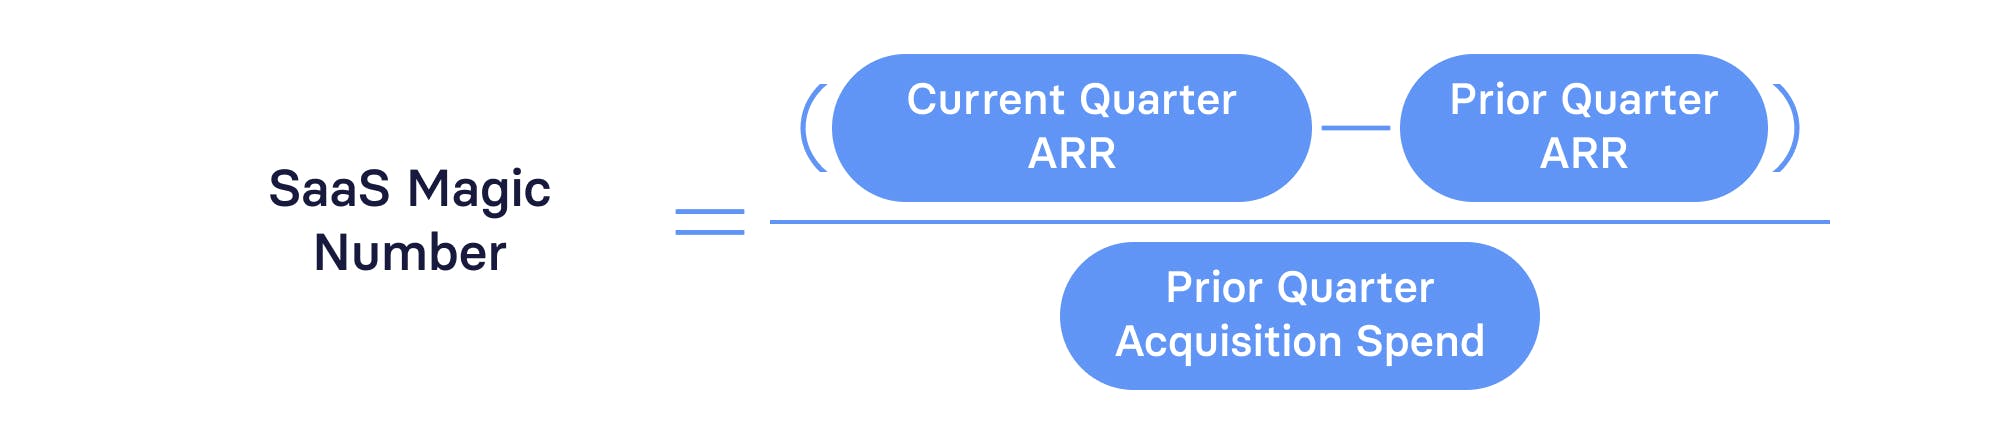
Magic Number
The SaaS magic number takes CAC even further. It determines how much revenue is generated from acquiring new customers over a specific period of time. A Magic Number of 0.75 or higher indicates a business that has a good product-market fit, efficient customer acquisition payback, and is ready to increase S&M spend (or redirect that funds to extending your runway).
Rule of 40
By comparing revenue growth to profitability, the rule of 40 is an at-a-glance insight into the health of your business performance. Though less reliable for younger companies, this rule asserts that a company is healthy so long as it maintains a combined growth rate and net profit margin of at least 40% or more. Companies that track and hit the rule of 40 benchmark each quarter often see higher valuations (as measured by The Software Equity Group).

SaaS Quick Ratio
The SaaS quick ratio is a quick benchmark that shows whether a company is getting top-line growth with a low churn and contraction rate. An average (1 to 4) or unhealthy (less than 1) score shows you where opportunities exist. A healthy score of 4 or higher indicates to investors that you have a solid, healthy start-up — though be prepared to provide more granular insights during fundraising phases.

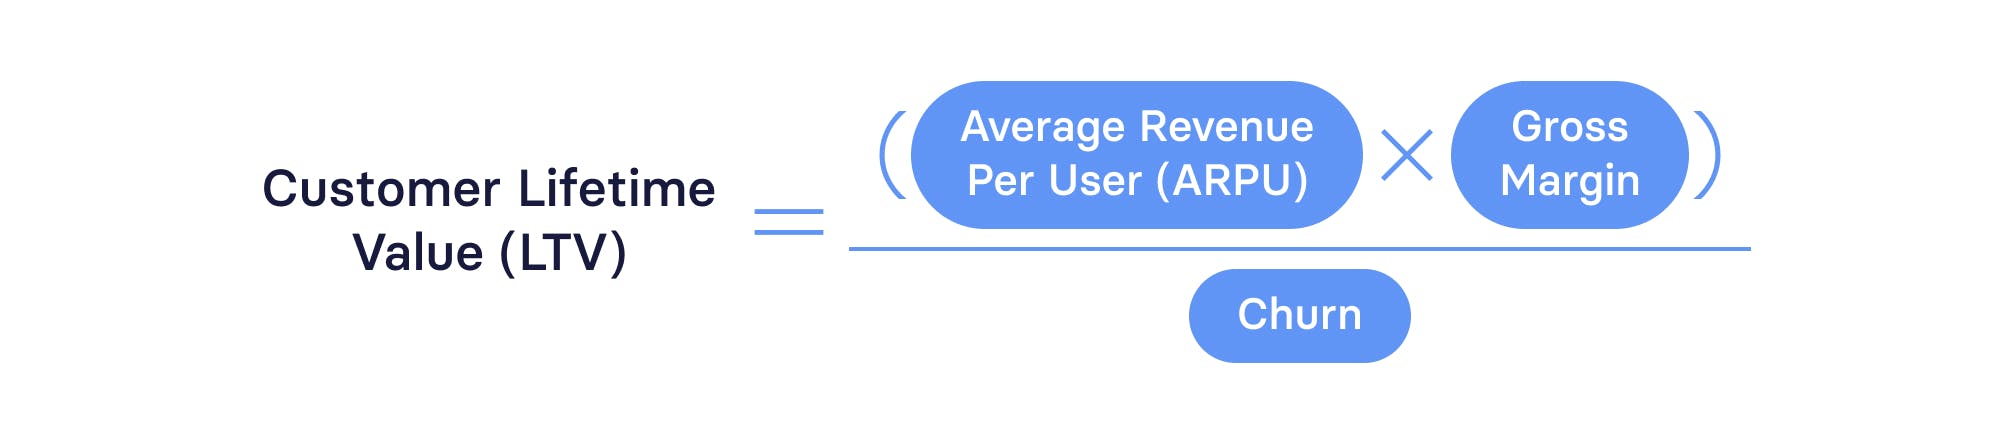
Customer Lifetime Value (LTV)
Customer lifetime value represents the average sales you can expect to receive from customers from first to last purchase. It gives you a long-term view of your business model. It provides insight as to whether your company needs to refine customer acquisition strategies or adjust customer retention strategies. LTV is also useful for accurate forecasting and planning.
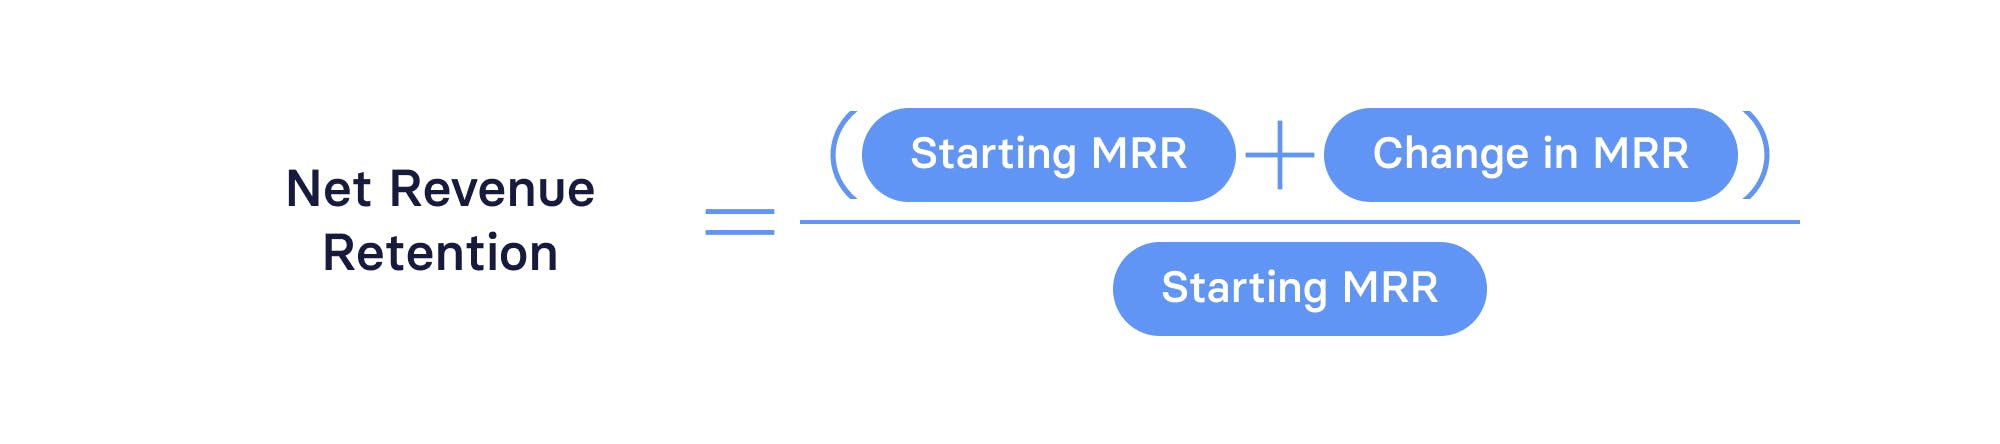
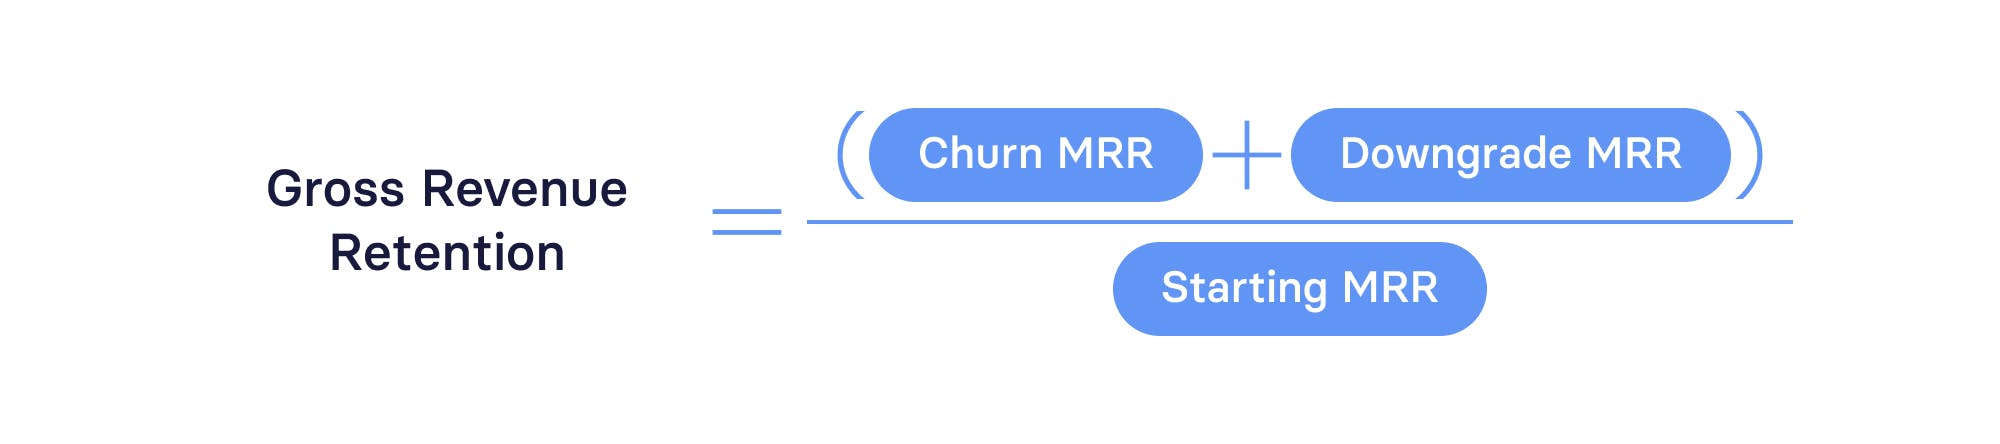
Revenue Retention
Revenue retention is broken into two categories. Your net revenue retention (NRR) tells the story of your business’s scalable growth. NRR measures the percentage of revenue maintained by existing customers. A high NRR signals a happy customer base that possibly wants the opportunity to deepen its relationship with your business.
Your gross retention rate is a more conservative revenue metric that excludes price increases and expansion within the existing customer base. This calculation opens the door to information about your company’s efficiency at retaining revenue over its lifetime. A high GRR signals a company that knows how to keep customers happy long-term.
Cash Runway
A company’s cash runway tells you how many months it can last before depleting its cash on hand. Just divide the total cash on hand by your net burn (the three-month average). It acts as a timer counting down the time a company has from one round of fundraising to the next.
Net Burn
Net burn measures how quickly your startup is using its money (in terms of total monthly cash loss). Tracking net burn lets you understand what efforts are driving business costs and which revenue streams offer the greatest potential. Use your net burn rate to direct your company’s efforts to more efficient ends and push for stronger valuation during your next round of funding.

Cash Balance
Your cash balance is the amount of money available to keep your business operating, and tracking it helps you monitor your company’s liquidity. To calculate your cash balance, you’ll need to account for all cash equivalents, accounts payable and accounts receivable, and your cash flow activity over a certain period. Monitoring your cash balance is important to tracking many other key metrics.
Revenue
Total revenue, in terms of top-line growth, shows how effective a company is at generating sales. Digging into the revenue details can provide a ton of insight into current strategies. It can indicate when the sales team needs to alter its tactics or when the marketing team needs to adjust its target audience.
Recurring Revenue
Drilling down into the revenue line, your Recurring Revenue gives you insight into your product-market fit and subscription and pricing models. It can also show when you need to invest back into the business. You can track recurring revenue as ARR, MRR, or annualized MRR.
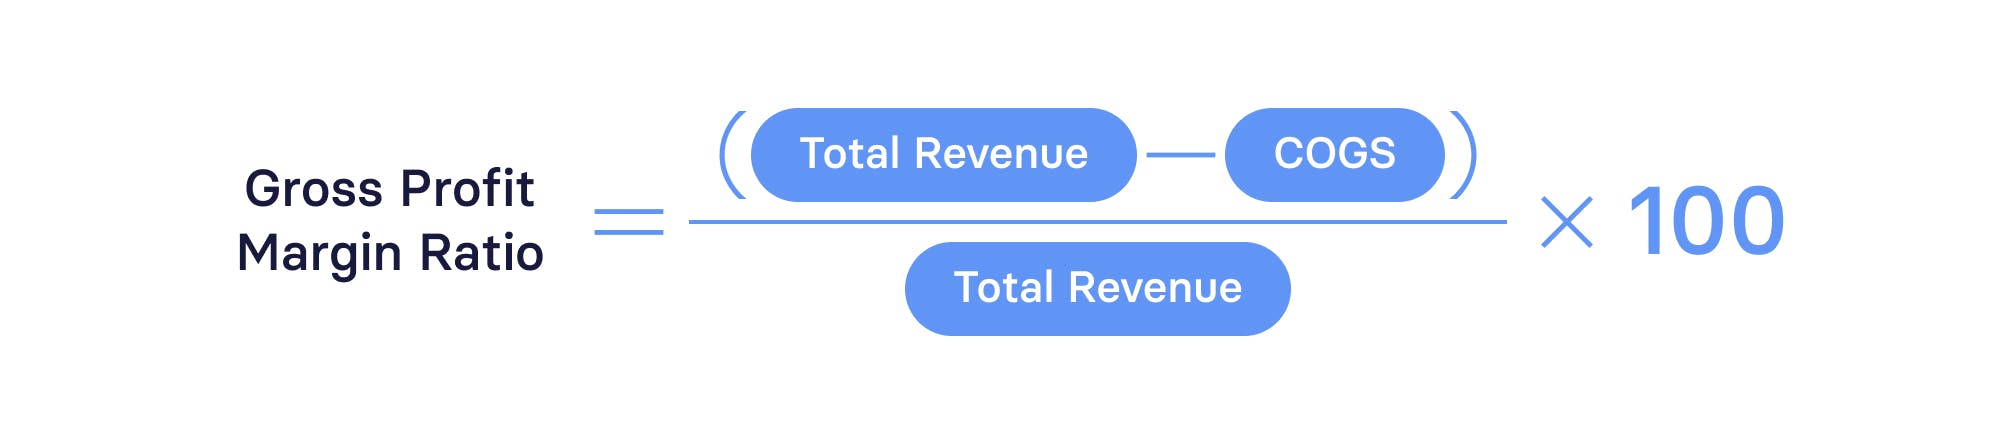
Gross Margin
Gross profit ratio — more often called gross profit margin — measures the profit ratio of how much money you have left over when you subtract the cost of getting your product to the consumer. It’s critical to price your product in accordance with the costs it takes to produce it. A low gross margin indicates your subscription price is too low or that the cost of revenue is too high.
Operating Expenses
Operating expenses highlight operational activities, which gives you greater insight into how well your business model generates revenue. There are a bunch of operational efficiency metrics you can use to see where your business is performing well and where it needs a new approach. We’ve covered several already, but here are a few additional metrics worth mentioning:
- ARR per head
- Burn multiple
- Cash conversion score
- Expenses as a percentage of revenue
Net Income
Net income is your net earnings, aka the bottom line. It’s the most obvious indicator of your profitability. And even though VC-backed startups generally turn a loss in early stages, paying attention to net income trends shows how strong a path you have to profitability. It’s an extremely important metric for getting you to a strong IPO.
Track All of These Metrics & More with Mosaic

CFO Dashboards and Examples
Your goal shouldn’t be to build a single CFO dashboard that applies to every aspect of your role and responsibilities. Instead, you should assemble dashboards for various needs, so you always have the at-a-glance visibility necessary to make the best financial decisions.
There are countless ways you could mix and match the metrics that matter as a finance leader. Instead of wasting time trying to figure out which mix of metrics to use for different use cases, take advantage of the following examples to get started faster. These are pre-built dashboards in Mosaic that give you real-time financial data and drill-down flexibility.
Example 1: Cash Flow Analysis Dashboard
One of the most important roles any finance leader has is to be a steward of capital for the business. It’s why having a solid cash flow analysis dashboard is so important. This CFO dashboard example will give you both the high-level and granular views of cash coming into and going out of your business.
Metrics that make up this dashboard include:
- Cash balance
- Net burn
- Cash runway
- Collections
- Cash inflows and outflows
The cash flow dashboard also includes visualizations of net burn trends as well as an embedded cash flow statement for full visibility.
Example 2: Income Statement Analysis Dashboard
For finance to strengthen its position as a strategic partner in the business, you need to offer deep insight into top-line vs. bottom-line growth. That means going beyond basic financial reporting to tell a narrative around the P&L. This dashboard helps you look closer at your revenue and expenses.
Metrics that make up this dashboard include:
- Revenue
- Gross margin
- Expenses (general)
- Expense composition
- Expenses as a percentage of revenue
- Top 10 vendors
- Net income
- Rule of 40
Example 3: Operational Efficiency Dashboard
In the midst of an economic downturn, your company’s ability to guide the business toward sustainable, efficient growth is essential. Having a CFO dashboard dedicated solely to tracking capital efficiency can give you insights needed to have strategic conversations with business partners about weathering the economic storm.
Key financial efficiency metrics on this dashboard include:
- Cash conversion score
- Burn multiple
- Rule of 40
- Expenses as a percentage of revenue
- SaaS quick ratio
- CAC ratio
- CAC payback
Build Custom Dashboards with Mosaic
You can combine metrics from all parts of your finance tech stack and sync your systems into one effortless workflow with the Mosaic dashboard. And there are three ways to customize yours — plus advisors and tailored training to ensure you can unlock the full potential of this tool.
To create your SaaS dashboard, you can start with a basic template that includes GAAP, P&L, Cash Flow, and Balance Sheet. Then add non-financial metrics and adjust the layout to your exact needs. You can also start with a grab-and-go dashboard template and add to it later as needed. The examples listed above are just a few of the pre-built dashboards in Mosaic. Others include:
- Budget variance analysis dashboard
- Month-end close review dashboard
- Headcount analysis dashboard
- SaaS acquisition metrics dashboard
In addition to the pre-built templates, you can also customize from the bottom up and build your dashboard piece by piece until it’s exactly what you need (and none of what you don’t).
Customization is nothing without functionality. Our dashboard provides you with the tools you need to tell the full story of your business performance with accurate, up-to-date financial reporting, customize your reports to fit company needs, and share them with all stakeholders quickly. With a clear view of your business’s health in real-time, you can address anything that’s underperforming, drill down to the roots of each metric, and stand out as a forward-thinking strategist.
Want to learn more about how you can build your own dashboards in Mosaic? Reach out for a personalized demo.
CFO Dashboard FAQs
What should a CFO dashboard include?
A CFO dashboard should be customized to the needs of your company right now. You and your finance team should choose which metrics matter most and include those on your dashboard. Common metrics Chief Financial Officers like to keep their eyes on at all times include MRR, operating cash flow, runway, and churn rate.
What is the most important financial ratio for a CFO?
Can you build a CFO dashboard in Excel?


Own the of your business.
