Capital Efficiency
What Is Capital Efficiency?
Capital efficiency refers broadly to how efficiently a company spends its money to operate and grow, and specifically, measures how much money is put into the business versus how much money the business generates from that investment. There are multiple capital efficiency metrics you could track depending on your business model and maturity. Some examples include cash conversion score, burn multiple, return on capital efficiency (ROCE), hype ratio, and Bessemer’s Efficiency Score.
Categories
Growth is always the name of the game for VC-backed SaaS businesses. And when more venture funding is always readily available, a growth-at-all-costs strategy may make sense. But more often than not, capital efficiency has to counterbalance high-growth strategies.
There are many ways to track capital efficiency for your business. Here’s how to think about the broad concept and how specific metrics like cash conversion score can improve your ability to track the financial health of your business.
Table of Contents
What Is a Cash Conversion Score?
Cash conversion score is a critical capital efficiency metric for SaaS companies that measures current return on investment (ROI) of dollars put into the business. By looking at current ARR, total raised capital, equity, debt, and cash through the cash conversion score, you gain a deeper understanding of your top-line recurring revenue as a proxy of ROI.
When you combine cash conversion score with additional metrics, you can gain deeper insight into product/market fit and the scalability of your sales and marketing teams.

Cash Conversion Score vs. Capital Efficiency Formulas
As an umbrella term, capital efficiency relies on multiple efficiency metrics to add context and illustrate the company’s financial performance when it comes to how much revenue it generates per dollar raised or invested. To get to the most forward-thinking solutions, you need to understand how to optimize each metric, from calculation to methodology of implementation to the end result.
Cash Conversion Score
To calculate your cash conversion score, take your current ARR and divide it by the difference between total capital raised to date and your net of current cash (your equity and debt minus cash from your balance sheet).
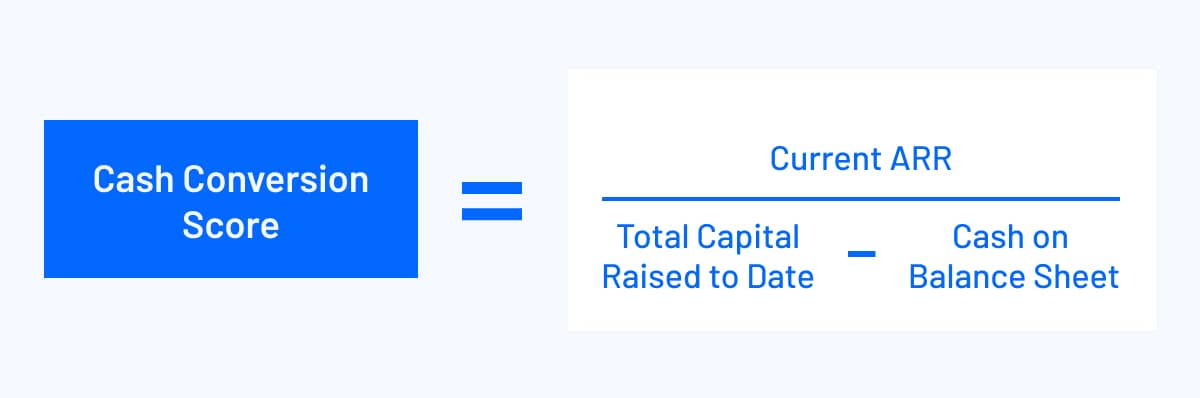
Bessemer Venture Partners set the cash conversion score formula and benchmarks to evaluate prospective companies’ future success. The cash conversion score calculation results on a scale between 0.25x and 1.0x+, where a 1.0x score means that a company makes $1 of top-line recurring revenue per $1 invested in the business. Bessemer divides scores into a “Good, Better, Best” framework:
- Good. A cash conversion score of 0.25x to 0.5x indicates an internal rate of return of about 40%.
- Better. A cash conversion score of 0.5x to 1.0x correlates to an internal rate of return of about 80%.
- Best. A cash conversion score of 1.0x or better is considered best-in-class, translating to a 120% internal rate of return.
While ROI is not driven by cash conversion score, it does point to multi-year trends, such as product/market fit as the company scales its sales and marketing efforts.
Burn Multiple
Craft Ventures founder and general partner David Sacks wanted a metric that would point toward capital efficiency in times of market downturn. Through comparing the hype ratio and Bessemer’s efficiency ratio, Sacks created the burn multiple (an inverse of Kellogg’s hype ratio).

Instead of purely focusing on marketing and sales efforts like LTV/CAC ratio inherently does, Sacks places the burn multiple to consider every business action as it impacts generating revenue and extending runway. As an annualized formula, the burn multiple can be tracked by month, quarter, or year, which allows it to be applicable to any growth stage at any given time.
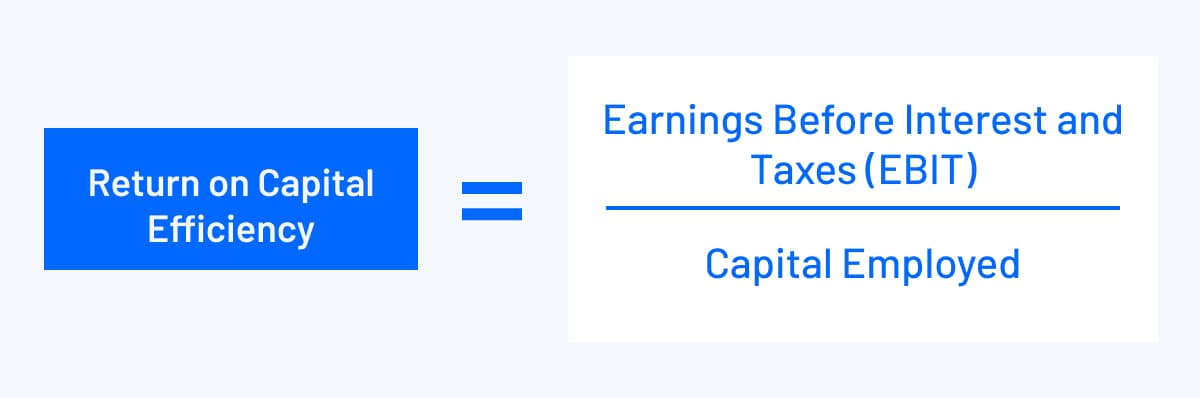
Return on Capital Efficiency (ROCE)
Cash conversion score is a newer metric for capital efficiency. Historically, capital efficiency and return on capital efficiency (ROCE) have been interchangeable terms — particularly in the context of corporate finance at public companies.
The traditional capital efficiency calculation per ROCE is your company’s earnings before interest and taxes (EBIT) divided by your capital employed (your total assets minus current liabilities).
Your ROCE gauges the company’s performance, as it looks at overall net profit. A high ROCE score shows a higher percentage of the company’s value returned as profit to stakeholders within a specific period of time. To get the most out of ROCE, it’s best to compare competitors’ ROCE ratios to gain a sense of the marketplace. You also want to expand your ROCE findings with other return ratios, like return on invested capital, return on assets, and return on equity, to gain a complete picture of your revenue.
ROCE is more appropriate for gauging the profitability of public companies, as it’s not an accurate representation for companies with large, unused cash reserves (such as Seed Stage, Series A, and Series B companies).
Bessemer’s Efficiency Score
As ROCE is for more mature companies, many SaaS startups were unable to assess their capital efficiency effectively. Startups expect large cash burn to develop the company, from product development to department headcount. But growth relies on continued investment — which is where finance crafts the narrative around capital efficiency to continue scalable growth.
Bessemer Venture Partners offers their straightforward efficiency score formula, where you take your net new ARR and divide it by net burn.

This calculation benchmarks efficiency in regards to how sustainable the company’s cash burn is and how well the company will do if the market experiences a downturn. The efficiency score runs on a similar “Good, Better, Best” framework as your cash conversion score, with less than 0.5x (Good), 0.5x-1.5x (Better), and higher than 1.5x (“Best”).
You want to compare efficiency across multiple time periods to create the full picture of efficiency across a sustained timeline.
Hype Ratio
Dave Kellogg considered SaaS valuation in regards to literal “hype” around a company — the type of buzz that excites investors and pushes companies into unicorn and decacorn valuations. Kellogg considered how to quantify the appeal, which led to the hype ratio.
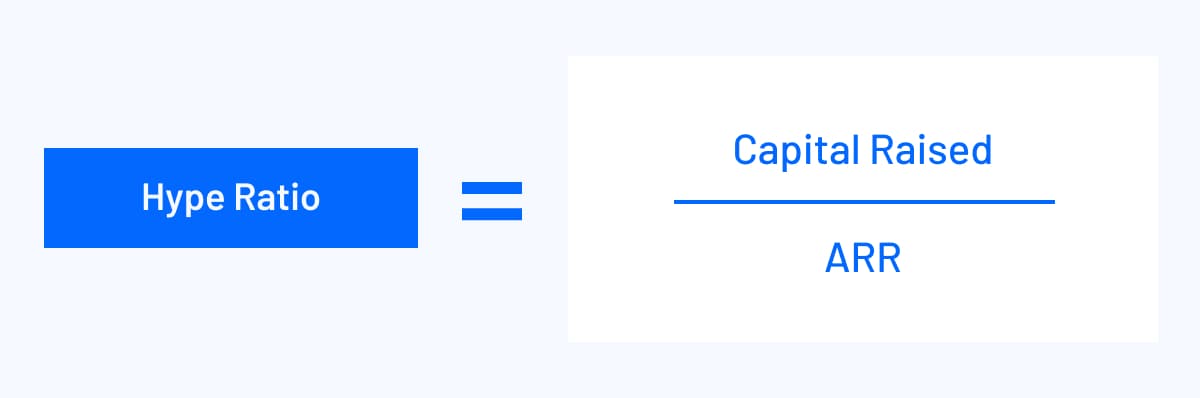
Kellogg determined that venture capital, when spent correctly, turns into ARR and hype (primarily customer response, which further increases ARR). So, to find the hype ratio itself, Kellogg divides capital by ARR.
Customer response — especially when desiring to drive new ARR — relies on how efficiently the company can reduce sales and marketing costs. Referrals and word of mouth should impact these departments’ efficiency as much as possible. In regards to benchmarks, it’s important to contextualize hype within the company’s growth stage. A “1-3” hype ratio is good, but between “3-5” means that there is too much hype with too little ARR (and above 5 means there’s barely anything there).
The hype ratio is also only good until IPO, since private companies should be able to raise and burn capital efficiently to arrive at the IPO stage at near zero. To optimize on the hype ratio, you need to calculate it on a monthly to quarterly basis to ensure product/market fit. It’s also worth checking your CAC and average sales cycle to see how customers move through your marketing and sales processes, and where there’s room for improvement.
Why Capital Efficiency Matters for SaaS Startups
The SaaS industry is growing at a rapid pace — and with that growth comes more competition and need to claim product/market fit and hype early. VCs are going to be much more selective with their investments. It’s important to show strong fundamentals and a healthy growth trajectory, which means you need to position yourself as a solid bet for VCs if you want to raise with the best possible terms. Capital efficiency shows that you can pace your growth within your market conditions.
Sustains Growth
Capital provides a means for early-stage SaaS companies to invest in optimal growth initiatives, such as headcount planning across departments. Engineers are required to develop a product, but the company doesn’t need to build a marketing and sales team until the product is truly ready to enter the market. Capital efficiency provides the insight to work on a steady growth plan versus “growth at literally all costs.”
Generates Investor Interest
Efficient companies understand how their decisions affect not just their reputation, but those of their investors. Investors want to see the company succeed, and finance crafts that narrative through discovering the “why” behind the numbers — which extends into how capital helps to generate revenue.
Generating $1 million in revenue with a $2 million burn is better than at $5 million burn. The lower burn rate points toward finance collaborating with the marketing and sales departments to help determine where their strategies are successful, and where there’s room for improvement to continue efficiency across the board.

Extends Runway
Capital efficiency extends your runway, especially in times of market downturn or volatile market conditions. Your runway relies not just on recurring revenue, but how leadership approaches their decision-making when the pipeline or sales cycle may slow down. Overspending or burning money on large marketing campaigns or miscalculating headcount may lead to layoffs in the future — which is a sign of inefficiency when it comes to sustaining growth.
How to Take Your Capital Efficiency to the Next Level
Your benchmark for capital efficiency depends on your industry. While a 1:1 capital efficiency ratio is good, the ideal is 3:1. Capital efficiency optimization requires looking at the full picture of your company’s financial health.
Finance is in the perfect seat to bring out deeper insights through other financial efficiency ratios, which help to evaluate where your revenue is now and how you can forecast future growth. These SaaS financial metrics are the heartbeat of your business and the primary levers you can pull to optimize performance, growth, and access to fresh capital.
- CAC Ratio: Your CAC ratio provides a micro-level view into your revenue, as it accounts for customer acquisition cost (CAC) in relation to sales and marketing campaigns. Pair the CAC ratio with your CAC payback period to determine when new customers convert to generating revenue. Your findings illuminate where sales and marketing continue to succeed and where they can improve in terms of their efficiency in getting customers through the pipeline.
- Customer Lifetime Value (LTV): Your LTV relates to your hype, in that it determines the average amount of money you’ll receive from customers over their lifetime. A long LTV means customers remain excited about your product, which may increase with more renewals, upgrades, and referrals. LTV sets a precedent for your CAC and CAC payback periods, and informs retention strategies so as to extend LTV.
- Human Capital Efficiency: Your human capital efficiency considers your revenue per head or full-time employee to determine how many employees it takes to sustain current ARR or forecast for new ARR. It provides another micro-level observation toward properly aligning growth with an eye on your capital efficiency.
- SaaS Magic Number: Your SaaS magic number looks at sales efficiency by answering, “How much revenue do we generate from our sales and marketing efforts?” The magic number provides a holistic view of business growth within a specific time period.
How to Track and Assess Capital Efficiency Growth in Mosaic
Your cash conversion score is a must-know metric for the company’s growth — yet the information you need to assess and calculate your capital efficiency is spread out across spreadsheets and systems. To collect, clean, and reconcile that data manually takes hours, and by the time it’s ready to review, the information is outdated. You’re left being reactive instead of proactive toward creating viable solutions, which isn’t a great spot when you’re ready to track and improve efficiency.
Mosaic integrates with your source systems to become a truly Strategic Finance Platform that allows you to manage the KPIs that drive your business. You’ll determine which operational levers to pull and impact future projections so you can stay on track, well-funded, and positioned for success in any market environment.
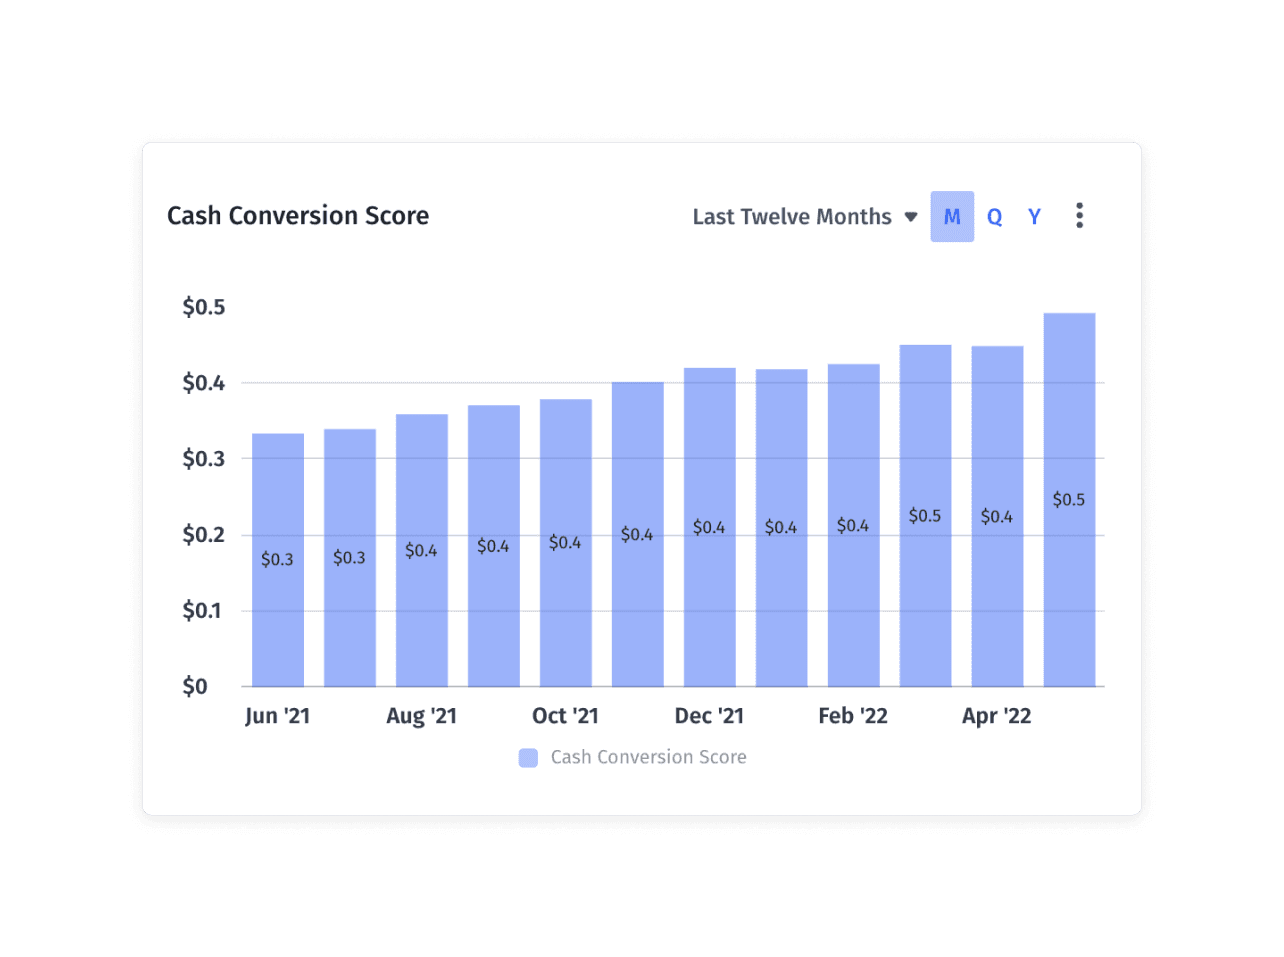
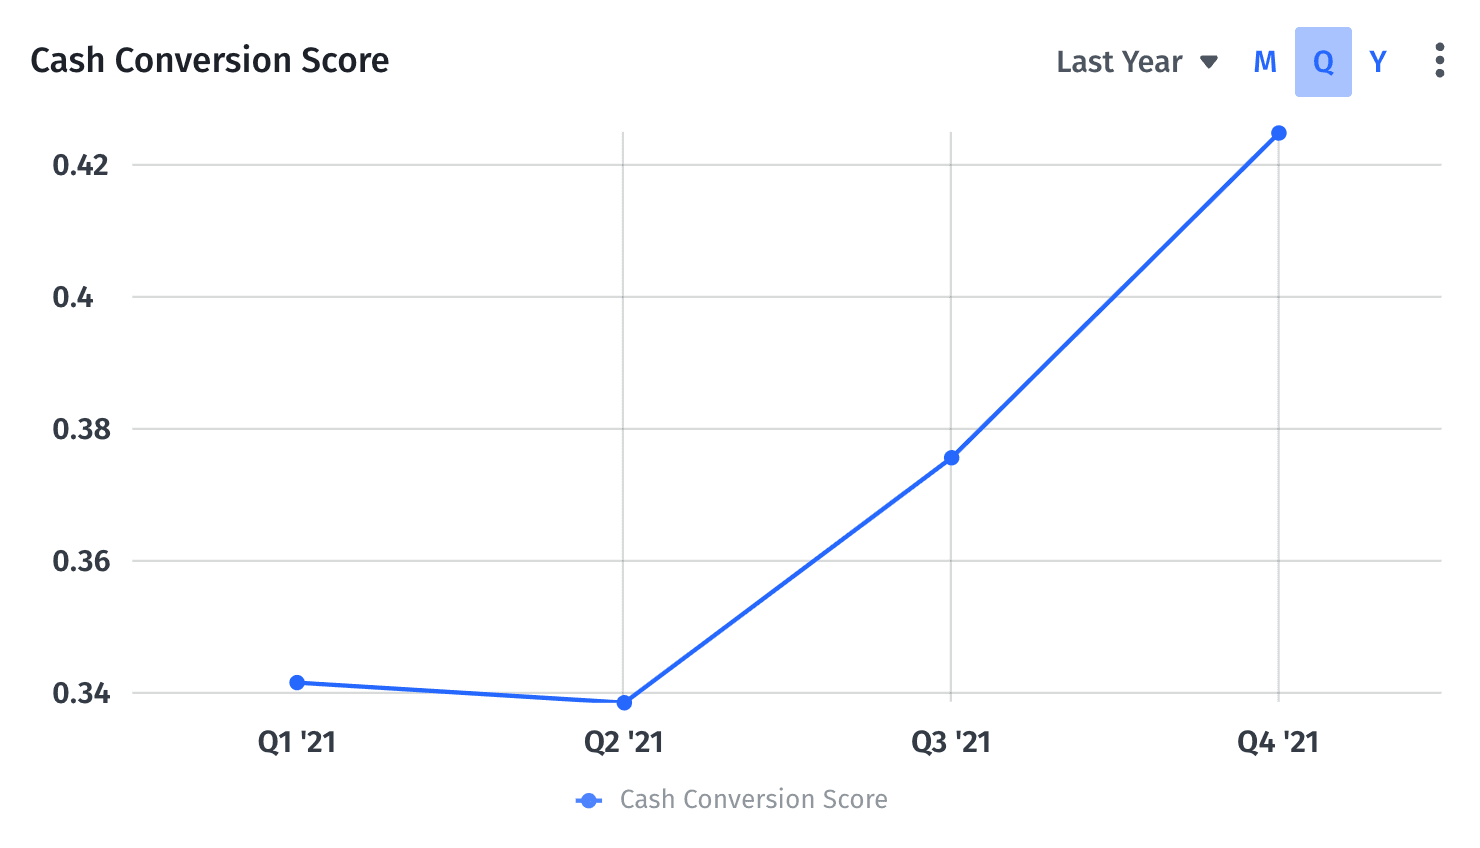
Your cash conversion score is one of the essential capital efficiency metrics that you can analyze through Mosaic’s pre-built templates. All you have to do is select the metrics you want to analyze, and whether you would like to view the metrics in a pre-built dashboard or create a custom report. Mosaic’s point-and-click analysis and interactivity allow you to dive deeper into the key business drivers and trends behind the numbers of your present capital efficiency or overlay future forecasts.
Mosaic pulls and updates data from your entire tech stack in real time, so your reports remain up to date and allow you to collaborate with executive leaders to create the viable solutions that drive efficiency across the company. Request a personalized demo today, and drive efficiency through the power of having the right information at the right time.
Capital Efficiency FAQs
How does capital efficiency differ from operational efficiency?
Capital efficiency focuses on how effectively a company can generate revenue from the money it has invested into the business, while operational efficiency concentrates on how well a company utilizes its resources, like labor, materials, and technology, to deliver goods or services. Although they’re different, improving operational efficiency can contribute to better capital efficiency, as it may reduce costs and increase revenue generation.
Can a startup with a low cash conversion score still be successful?
How often should a company track its capital efficiency metrics?
Explore Related Metrics


Own the of your business.
