

Whether you’re an early-stage, growth-at-all-costs startup or a more mature company, understanding how efficiently you can turn dollars invested into revenue earned matters.
Finance has the unique, big-picture perspective of the business to understand that efficiency better than anyone else.
But how do you actually go about tracking it beyond the financial statements? Here’s how to think about financial efficiency in your business—why it matters, which metrics you should be tracking, and how to improve it as your company grows.
Table of Contents
What Is Financial Efficiency?
Financial efficiency is a big-picture measure of how successful a company is at turning expenses from product development, sales, and marketing into revenue.
There’s no single “financial efficiency” metric that finance leaders should be monitoring, though. Depending on your business model and SaaS pricing strategy, many different metrics could highlight your efficiency in generating annual recurring revenue (ARR).
Truly understanding your financial efficiency starts with identifying the right ratios for understanding how your specific organization’s assets and liabilities turn into revenue. And the deeper insight you have into those ratios, the easier it is for finance to forecast future profitability and identify growth opportunities.
What Are Financial Efficiency Ratios?
Financial efficiency ratios are key indicators that measure how well a company utilizes its assets and liabilities to generate sales and maximize profits. These ratios provide critical insights into various aspects of financial performance, including operational efficiency, liquidity management, and the effectiveness of investment strategies. By analyzing these ratios, companies can identify areas for improvement, optimize their financial strategies, and enhance overall profitability.
Why Financial Efficiency Matters to Finance Teams and Leaders
If finance wants to be a true strategic partner in the business, it can’t just report the numbers. The only thing worse than being off on your numbers is not knowing why you are.
Financial efficiency metrics help point finance in the right direction for identifying insights about the business. They can shed light on whether or not your growth trajectory is sustainable and where you could potentially improve the health of your organization.
Take a look at connectivity company Zapier ($140 million in ARR) as an example. One prominent strategy toward their profitable growth included prioritizing employee productivity through automation.
Zapier saw an opportunity to leverage finance automation for expense reporting, giving employees a more self-serve experience while freeing up time the finance team would typically spend classifying data. Finance could reallocate that time to analyzing cost efficiency and plotting a path to greater profitability thanks to deeper insight into expense data.
In Zapier’s case, insight into financial efficiency is one reason the company could scale revenue with just $1.4 million in funding. It shows how finance can drive strategic growth in a business when leadership knows the “why” behind the numbers.
Get Cross-Functional Insights to Drive Efficiency

11 of the Best Financial Efficiency Ratios to Track
Financial efficiency ratios and metrics are powerful tools finance teams use to craft a company’s story. Like a chapter of a book, each ratio is powerful on its own. But when brought together, your corporate finance team can not only tell executive leadership, key stakeholders, and shareholders what the company’s path to growth looks like but apply a strategic lens to it.
But what are the most important financial ratios to analyze a company? There’s no definitive list, and the context of your company matters.
Liquidity ratios would matter to public companies but mean less for early-stage startups. An eCommerce business needs to track metrics like inventory turnover/asset turnover ratio, whereas software businesses don’t. And hardware businesses need to have a firmer grasp on supply chain efficiency and large-scale depreciation.
But for SaaS businesses, in particular, the following eight measures of financial efficiency should be top of mind.
1. SaaS Magic Number
The SaaS magic number is a sales efficiency metric that provides a holistic understanding of your business growth rate. This metric looks at the dollars’ worth of revenue created (ARR) for every dollar spent acquiring new customers (customer acquisition cost, or CAC) through marketing and sales. Here’s how you calculate it:
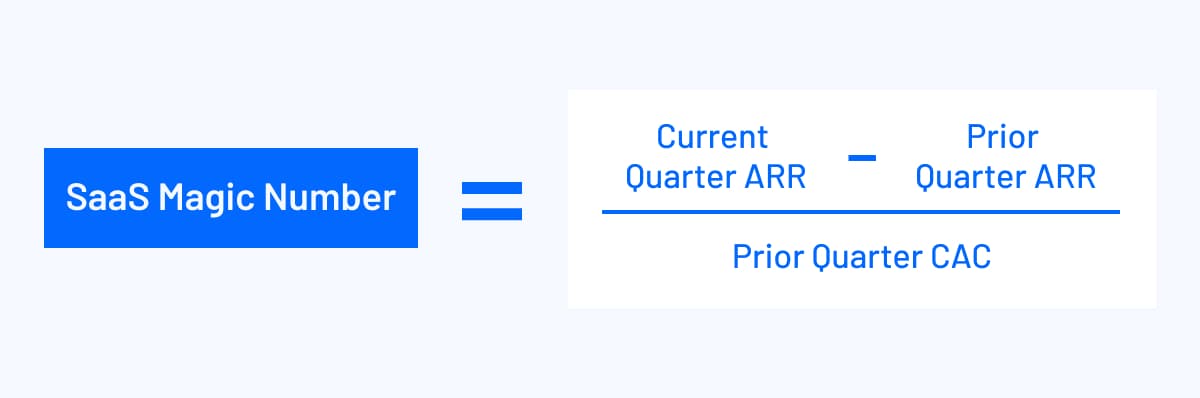
Once you have your magic number (which you measure on a scale of zero to one), you can understand how efficient your marketing and sales efforts are and whether you need to invest more (if the number is greater than 0.75) or less (if the number is less than 0.5) into those efforts.
2. Rule of 40
The Rule of 40 is a metric that balances growth and profitability against each other to determine the company’s sustainability. You calculate it by adding your growth rate and profit margin percentages together.

Ideally, when you calculate your Rule of 40, it should equal 40% or higher. That’s the common benchmark for sustainable growth (especially for later-stage SaaS companies).
3. LTV:CAC Ratio
Another sales and marketing efficiency metric, the LTV:CAC ratio, determines ROI per customer. You calculate the ratio by dividing customer lifetime value (LTV) in the numerator by CAC.
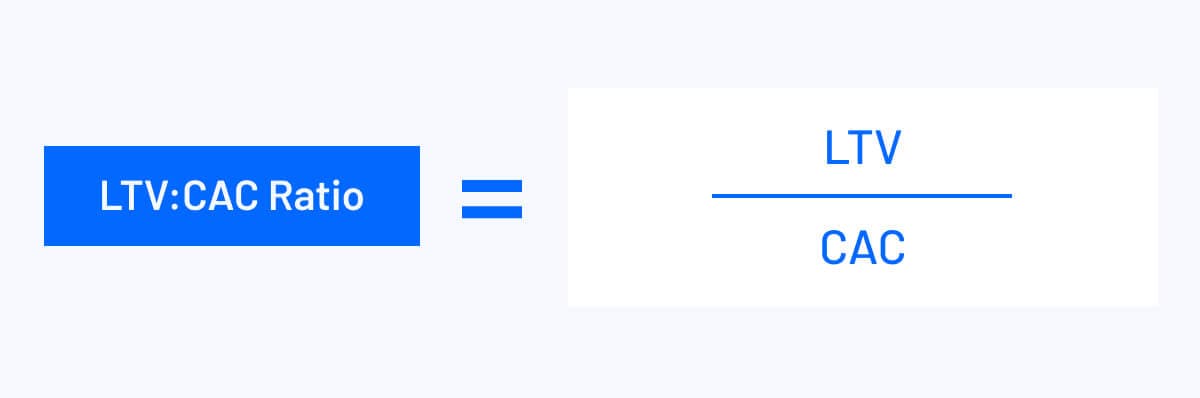
With the ratio, you can look at the long-term feasibility of your customer acquisition tactics and proactively make any necessary changes.
4. CAC Ratio
Customer acquisition cost plays a role in many of the ratios above, as it measures the cost to acquire a new customer. But the CAC ratio itself drives conversations around the success and improvement of current and future sales and marketing campaigns. Here’s the formula to calculate it.
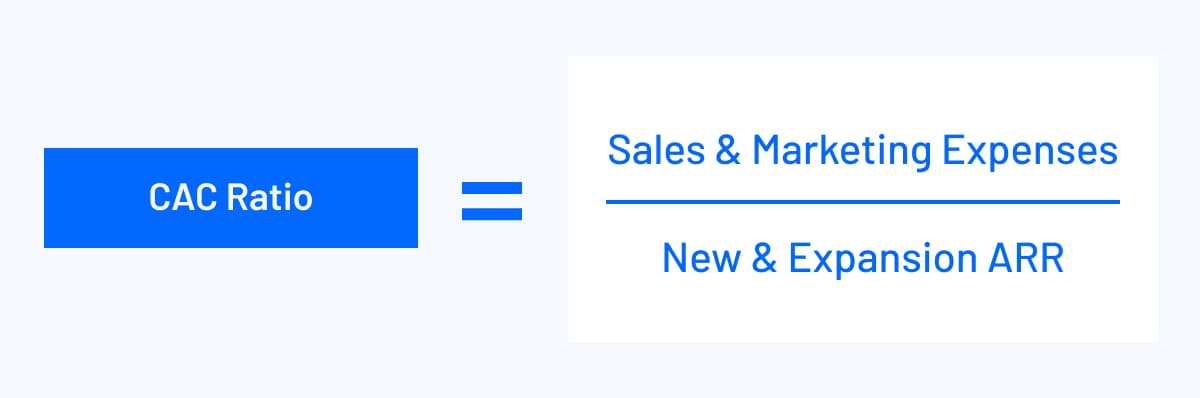
When you calculate this ratio, you compare marketing expenses to new and expansion ARR to discover the percentage of new customers you need to gain to recoup that month’s sales and marketing costs in one year.
5. Net Revenue Retention
Retention is a critical component of a business’s growth trajectory. Net revenue retention determines not only the value of your product for current customers but their satisfaction with other product factors, such as pricing, reliability, and customer service.
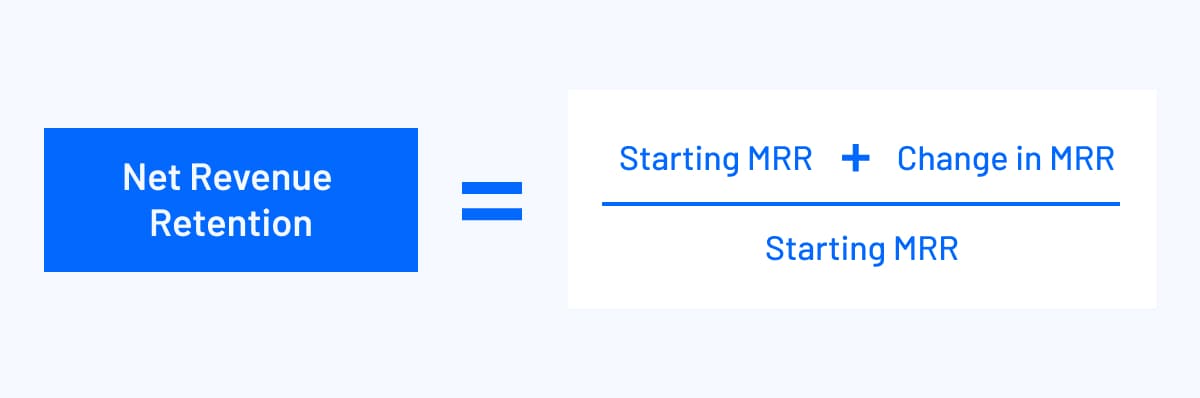
The common benchmark for strong NRR is 120%, which means your SaaS revenue is snowballing as existing customer accounts gain in value over time rather than churning. Strong NRR indicates that you could experience high growth that doesn’t rely entirely on new customer acquisition.
6. AR Turnover Ratio
As revenue is the amount of income generated by what your company sells, you need to know how efficiently your company receives payments from clients. The AR turnover ratio is an accounts receivable metric that takes your net credit sales and divides it by your average accounts receivable to determine how efficient your company is at payment collection.

Divide net credit sales by your average accounts receivable. Again, as customer acquisition and retention fluctuates, it’s best to calculate AR turnover per month versus multiplying it by 12.
7. Net Sales Efficiency
Net sales efficiency accounts for new customer acquisition and churn by looking at sales and marketing spend alongside new ARR. This metric provides a target rate of return for your sales and marketing activities. And it also accounts for the impact your customer success team has on retaining customers.

Teams often calculate net sales efficiency on a per quarter basis. Take your net new ARR for the quarter, then divide it by the sales and marketing spend for the quarter. If you want to calculate per month, change ARR to MRR.
8. Human Capital Efficiency
A company’s growth relies heavily on effective headcount planning, which is the single biggest expense impacting profit and revenue. Human capital efficiency measures the number of employees across the organization to determine how many it will take to sustain current ARR and create a forecast for new ARR. Inefficiency in this metric, or in similar metrics like revenue per employee, could point to issues in customer acquisition or misaligned ratios for department-level resources.
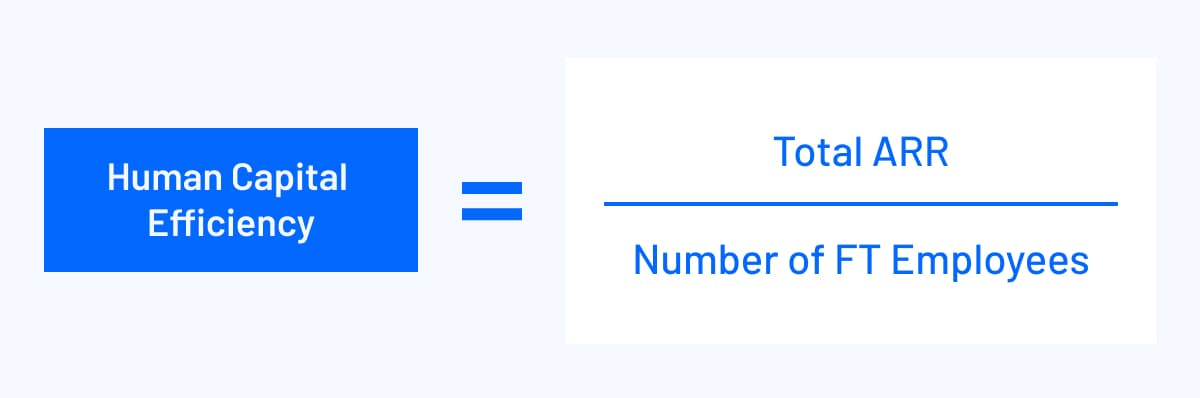
To calculate your human capital efficiency, take your total ARR and divide it by the number of full-time employees.

9. Burn Multiple
Burn multiple measures how quickly a company is spending its cash reserves relative to its growth. To calculate burn multiple you simply divide your net burn by net new ARR.

This ratio is crucial for startups and growth-focused companies, as it highlights the balance between cash burn and revenue generation.
10. Cash Conversion Score
Cash Conversion Score (CCC) evaluates how efficiently a company converts its cash investments into revenue growth. A higher score indicates a more efficient use of cash, making it a valuable metric for assessing operational efficiency.
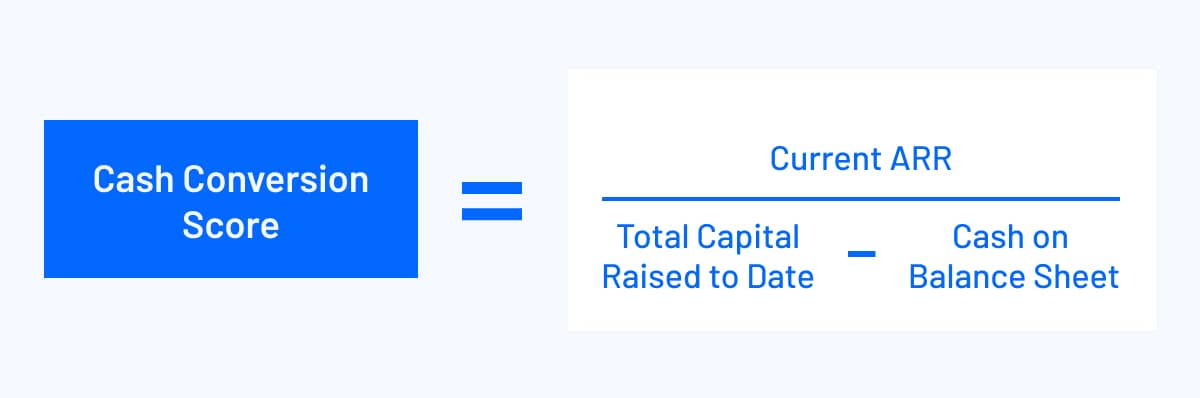
To find your cash conversion score, subtract the cash on your balance sheet from the total capital you’ve raised, and then divide your current ARR by that number.
11. Return on Capital Efficiency
Return on capital efficiency assesses the profitability generated from capital investments. It provides insight into how effectively a company is using its invested capital to generate returns, making it essential for investment decisions and financial planning.
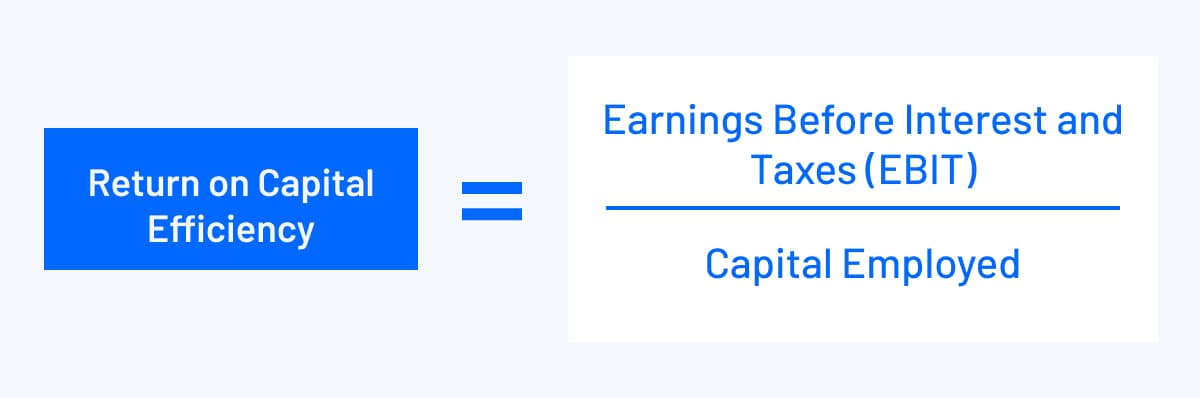
To find your return on capital efficiency, divide earnings before interest and taxes by total capital employed.
How to Improve Your Financial Efficiency
The most financially efficient companies find ways to maximize the productivity of operational functions while minimizing costs where possible.
To improve your financial efficiency, you need to find opportunities to optimize any and all aspects of your business, from customer communications to the daily tools and processes that drive your business. Start improving your financial efficiency with the following suggestions.
Improve Collaboration Between Finance and the Rest of the Organization
Finance knows the numbers better than anyone. When you can uncover insights into them for different department leads, you can help identify specific areas of improvement.
Yet not everyone will understand your complex spreadsheets. Improving collaboration requires finding a shared language within your business. Finance needs to break down the numbers and have conversations with department and executive leaders to ensure the working capital and budget are there for optimal, sustainable growth.
Make Scenario Analysis More Agile
If finance is stuck in manual processes, there’s minimal time to update financial models to analyze different scenarios continuously.
Strong scenario analysis examples forecast for base, worst, and best-case scenarios. Collaborating with department leads provides some answers to create more accurate models. But finance still needs to pull data from multiple source systems to create a cohesive narrative for each scenario.
Finance needs tools and technology that seamlessly pull actuals together and offer updated, real-time information that doesn’t rely on manual input to bring their findings to life through a model as quickly as possible.
When you make scenario analysis more efficient, you can get more visibility into potential outcomes of strategic decisions—and ideally make decisions that lead to greater financial efficiency.
Facilitate a More Data-Driven Approach to Marketing
Marketing is one of the most difficult areas of the business to plan around. Due to ever-changing campaigns and promotions, there’s so much uncertainty and ambiguity in how marketing activities tie to revenue.
Marketing needs ongoing facilitation—and data informs the conversations and questions you need to pose to your marketing team regarding budget. Do you truly understand how much you should spend on ads? Is there an event that requires more overhead than last quarter? What marketing efforts drive the most leads to your pipeline in the short-term—blog posts, webinars, templates—and how much does it cost to produce these assets?
The better you understand what works and what doesn’t in marketing, the easier it is to drive financial efficiency.
Automate Accounts Receivable/Collections
Your AR turnover ratio (not to be confused with your AP turnover ratio) will tell you everything about how well your collections process is doing. A low turnover means there are delays in customers paying you. If you can improve collections, you can increase financial efficiency by avoiding delays that could hurt cash flow.
AR automation can help you create and send invoices and reminders on specific dates, alongside reconciling payments with your accounting systems. But more than that, automating financial data can help ensure your chart of accounts structure stays updated, making it easier to track AR metrics.
Suppose your business model focuses on monthly subscriptions. In that case, customers should have the ability to set up auto-payments, too, and you end up with a more stable and controllable cash flow. Your finance team then has more time to gather insight and help make more proactive decisions based on more accurate numbers and forecasts.
Financial Efficiency Begins with Agile, Real-Time Data
When the numbers are off, your finance team won’t be able to accurately calculate the financial efficiency ratios that capture where your business is now and where it can go. But too often, finance teams are stuck spending all their time making sure last month’s balance sheet, income statement, and cash flow statement are accurate.
Mosaic’s Strategic Finance Platform automates the tedious parts of data collection and keeps your data updated in real-time so your finance team can proactively gather information and strategize for your immediate growth goals and beyond. And the efficiency ratios listed above are just a few examples of what Mosaic can unlock. The platform has 100+ out-of-the-box metrics like the SaaS quick ratio, gross revenue retention, net burn, net income, and more.
Ready to take your company’s financial analysis efficiency to the next level? Request a personalized demo.
Financial efficiency ratio FAQs
Are profitability ratios the same as financial efficiency ratios?
While there is some overlap, profitability and efficiency ratios are not the same. Efficiency ratios measure how efficiently a business operates overall. Higher operational efficiency usually leads to higher profitability, but profitability ratios alone cannot measure a company’s ability to run efficiently.
Is a lower or higher efficiency ratio better?


Own the of your business.
