

After years of “growth at all costs” being an acceptable norm, the landscape of VC-backed companies has shifted to an era of efficient growth. More than ever, the most successful high-growth companies are ones that can drive significant revenue growth with the greatest operational excellence and efficiency as possible.
Operational efficiency boils down to asking, “How much does it cost the company to produce a high-quality product or service, bring it to market, and continue to grow?” And that’s where SaaS finance comes in.
Finance teams have an opportunity to strengthen their strategic roles in the business by tracking the right operational metrics and surfacing insights that will drive efficient growth.
Operational metrics keep a pulse on more than just day-to-day workflows and resource utilization. Here are the operational performance metrics and key performance indicators (KPIs) you need to measure to uncover strategic insights about resource utilization, revenue growth, and cash management.
Table of Contents
What Are Operational Metrics?
Operational metrics measure business performance in terms of departmental contributions to overall revenue and expenses.
There are countless operational efficiency metrics that you can use to understand the health of your organization. The ones you pay the most attention to will depend on your business model and maturity. Because finance has the unique advantage of being able to see data from across the entire business, you have an opportunity to ensure your mix of departmental and company-wide operational metrics captures a well-rounded view of the business.
What Is an Operational KPI?
Operational KPIs are the short list of metrics you use as measuring sticks for overall business performance and tracking high-level goals. While “metrics” and “KPIs” can be used interchangeably, you can think of your operational KPIs as the summary-level metrics you’d show investors to prove you’re ready for the next stage of growth.
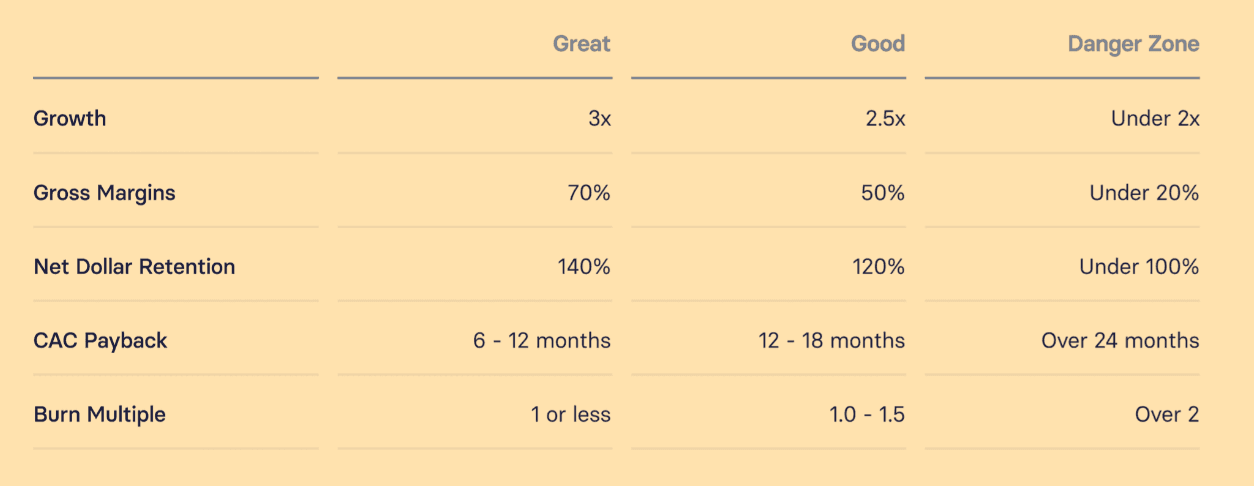
For VC-backed startups and growth-stage companies, it’s easy to think about operational KPIs as the metrics that are most impactful for pitching investors in your next round of funding. According to a Craft Ventures presentation about weathering the storm of an economic downturn, the five company-wide operational KPIs that matter most are ARR growth, gross margin, net dollar retention, CAC payback, and burn multiple.
Why Are Operational Metrics and KPIs Important?
Operational metrics and KPIs are critical to business success because they provide insight into where a company is working efficiently and where there’s room for improvement.
Tracking the right operational performance metrics and KPIs is important because they help you:
Maintain the Company’s Financial Health
Sustainable growth is near impossible without a healthy cash flow — and for operational efficiency, you need to pay attention to how operating costs impact runway and how revenue continues to build the runway out.
Control Cash Better
Key operational metrics dive deeper into departmental processes and systems to identify any waste and potential optimizations, which then leads to tighter spend and the potential to redistribute your budget allocation to other growth initiatives.
Correct Issues Sooner
When you’re able to implement data-driven decisions at the right time, it impacts the company’s present and future. Finance gains better accuracy when it comes to cash flow forecasting, scenario planning, and headcount planning, which furthers the lead time for better strategic decision making as the year progresses.
Be a More Proactive Business Partner
Business metrics and strategic decisions are only successful if everyone commits to the resolution. These types of metrics keep an eye on the macro- and micro-goals throughout the company. Partnering with other department leaders allows everyone to keep efficiency goals top of mind, which leads to further investment in the team down the road.
12 Key Operational Efficiency Metrics and KPIs to Track
If you ask different business unit and operations managers across an org what the key operational efficiency metrics are, you’ll get dozens of different answers. Human resource leaders might mention specific workforce planning metrics like absenteeism rate (unplanned sick time employees take). Production managers may mention various logistics metrics that highlight supply chain issues.
The following list focuses on the right metrics – those that are most important to finance’s ability to accurately assess the operational efficiency of a company as a whole. The 12 key operational efficiency metrics and KPIs for SaaS companies are:
- ARR per head
- Burn multiple
- Cash conversion score
- Net burn
- Gross margin
- Net income
- Expenses as a percentage of revenue
- SaaS rule of 40
- SaaS quick ratio
- SaaS magic number
- CAC ratio
- CAC Payback Period
Let’s dive in each below.
1. ARR Per Head
Annual recurring revenue (ARR) or revenue per head, looks at how much revenue employees generate for the company. To calculate this metric, take your total revenue and divide it by the number of employees.

The higher your ARR per head, the more efficiently you’re running your company from a workforce perspective. Be sure to benchmark yourself against similarly-sized companies at a comparable maturity level to get the best understanding of where you stand.
Don’t look at ARR per head in a vacuum. Employee turnover will reduce your total workforce, which will increase ARR per head. It’ll look like you’re in a good position, but if it means your employees are underwater, you have to address the problems with your headcount planning. You should start by closely tracking your employee turnover metrics.
2. Burn Multiple
Your burn multiple observes efficiency across the entire company in that it looks at how much revenue is generated per dollar burned. To find your burn multiple, divide net burn by your net new ARR for a given period of time.

Burn multiple plays a key role in cash management in that it takes a deeper look into how efficiently the company deploys capital from funding rounds. Ideally, your burn multiple is close to zero, but you should contextualize your burn multiple according to your growth stage.
3. Cash Conversion Score
Capital efficiency is a broad term for observing how efficiently companies spend money on operations and growth. A critical metric that captures both capital and operational efficiency is the cash conversion score, which looks at the current ARR and divides it by the difference between capital raised to date and cash from the balance sheet.
This is closely related to another important metric — days sales outstanding (DSO), which gauges how quickly a company collects payments after sales are made. Lower DSO can positively impact your cash conversion score by indicating efficient collection practices and better cash flow management. You end up with deeper insight into your top-line recurring revenue, return on investment (ROI), and cash collection efficiency.

Capital efficiency metrics are the types of metrics you want to bring into your operational efficiency evaluation, as they broaden your scope on customer satisfaction, customer retention rates, and sustainable growth.
4. Net Burn
Your net burn is your total monthly cash loss, which you calculate by taking your monthly total revenue and subtracting monthly operating expenses.

In times of market downturn, your business strategy shifts inward toward operational efficiency. Net burn evaluates how long you can operate without any investors (a.k.a. sustain your runway and profitability). Net burn is a pivotal part of calculating your runway (divide your total cash by net burn). You want to observe how net burn fluctuates from period to period and set benchmarks to ensure you hit or stay within the recommended 18-22 months of runway you need to sustain operations safely.
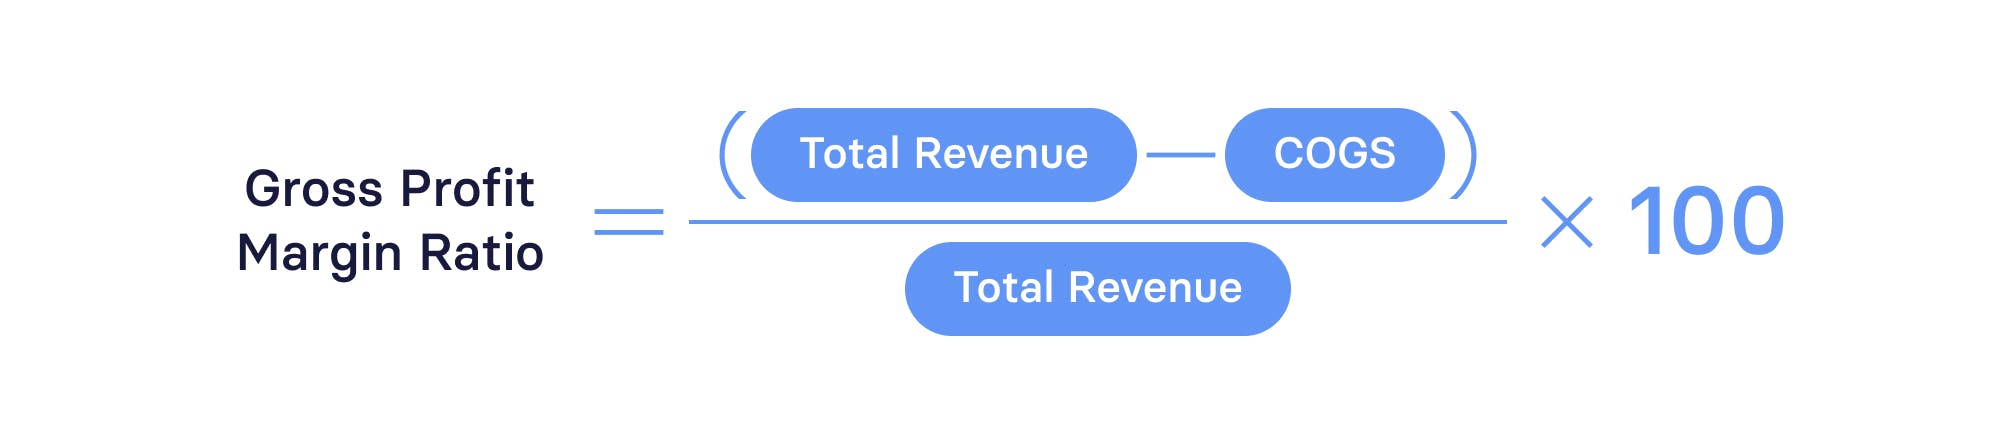
5. Gross Margin
Gross margin (or gross profit ratio) is a metric that tells you how much money the company keeps after factoring in the cost of revenue/cost of goods sold (COGS). Cost of revenue includes any costs for web-hosting services, performance monitoring, and engineer salaries, for example, which do impact operational efficiency as they form the core processes and workflows to conduct work.
A low gross margin ratio indicates that there may need to be cuts made to product development or that there’s an opportunity to reevaluate the SaaS pricing strategy. A consistently high gross margin ratio indicates that the timing may be right to reinvest in the company.
Because the cost of goods sold is so low, SaaS companies tend to have higher expectations for their gross margin (around 80 to 90%). Gross margin is a key metric that investors and executive leadership pay attention to, so it’s important that finance keeps operating costs (which are not part of the gross profit margin ratio formula) out of the equation to ensure accuracy.
If a customer service team member assists with sales and marketing, they fall under an operational expense — but if they only help existing customers, they fall under a COGS expense.
6. Net Income
Your net income, or net profit, is your bottom line. To calculate net income, take the company’s total revenue and subtract any expenses, such as operating costs and other business expenses (like rent for your building), tax provisions, and interest on debt and other income.

Net income is a market of profitability, which is linked to efficiency in terms of business operations. Because net income includes total expenses (versus gross margin), it captures more of your effectiveness in terms of operations. But be wary: Large sales, such as that of a building, increase your net income, which may mislead investors.
Together, gross margin and net income show a trend away from or toward profitability.
7. Expenses as a Percentage of Revenue
One of the biggest factors in operational efficiency is ensuring that you’re spending appropriate amounts of money on different departments. This is why it’s important to keep a close eye on expenses as a percentage of revenue.
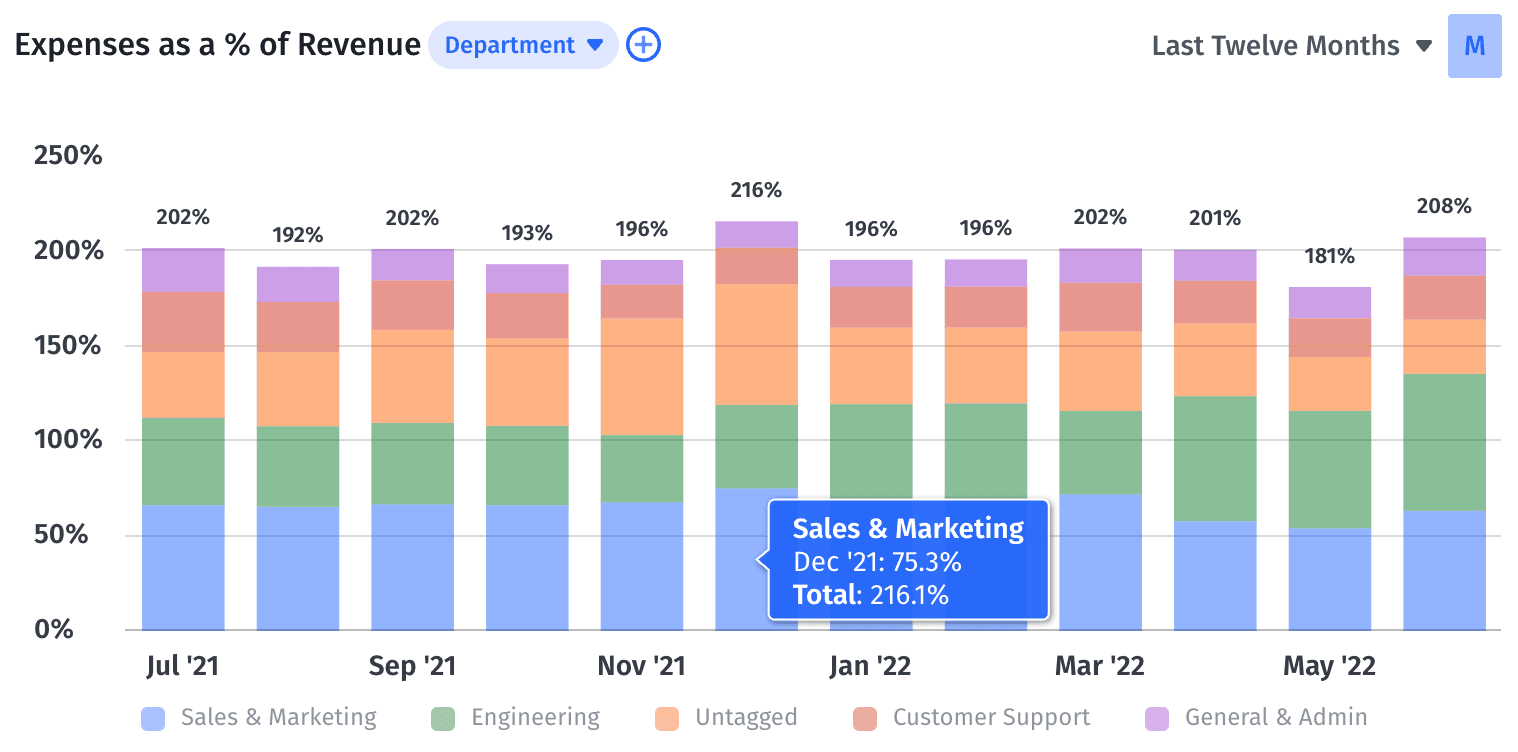
You can find departmental expenses as percentages of revenue by taking total spend in those areas, dividing by revenue for the given period, and multiplying by 100. For high-growth companies with negative net income, total expenses as a percentage of revenue will be over 100% (like in the chart above).
Use this information to track how you perform compared to industry standards. For example, a common breakdown of expenses in a SaaS startup is 50% on sales and marketing, 20% on product, and 10% on G&A. This breakdown may or may not make perfect sense for your business — but it can at least give you a rough idea of what makes sense for companies like yours.
Ultimately, the real value in tracking expenses as percentages of revenue is to track trends in your spending over time. When you identify concerning trends, you can share those valuable insights with relevant business partners and proactively resolve any issues.
8. SaaS Rule of 40
The SaaS Rule of 40 tracks performance while considering growth and profit as a measure of success. To calculate this operational metric, add your growth rate percentage to your profit margin percentage for a given time period.

An outcome of 40% or higher means that the company is healthy.
While the formula is simple, choosing the growth and profit drivers isn’t as clear. For SaaS companies, using total revenue as your growth input makes the most sense if subscriptions account for less than 80% of that revenue.
In the context of operating income vs. EBITDA, your profit driver will depend on your business model. Although EBITDA margin is often preferred, options like net income, net operating income, free cash flow, or earnings before interest and taxes (EBIT) can also be suitable.
9. SaaS Quick Ratio
The SaaS quick ratio is key to analyzing both sides of growth, increasing net new upsells while minimizing downsizing and churn.
To calculate the SaaS quick ratio, you’ll take your monthly recurring revenue (MRR) or your ARR growth (new and expansions) and divide it by the total of your losses (downgrades) and churn in MRR or ARR.

The SaaS quick ratio provides a glance at top-line growth and revenue reductions (any costs to run the business). While it’s best to bolster this metric within the larger conversation of efficiency, investors and executive leadership still favor it since it can help predict whether net recurring revenue will increase or decrease. The ratio serves as a flag to investigate processes and implement changes sooner to ensure net revenue growth.
10. SaaS Magic Number
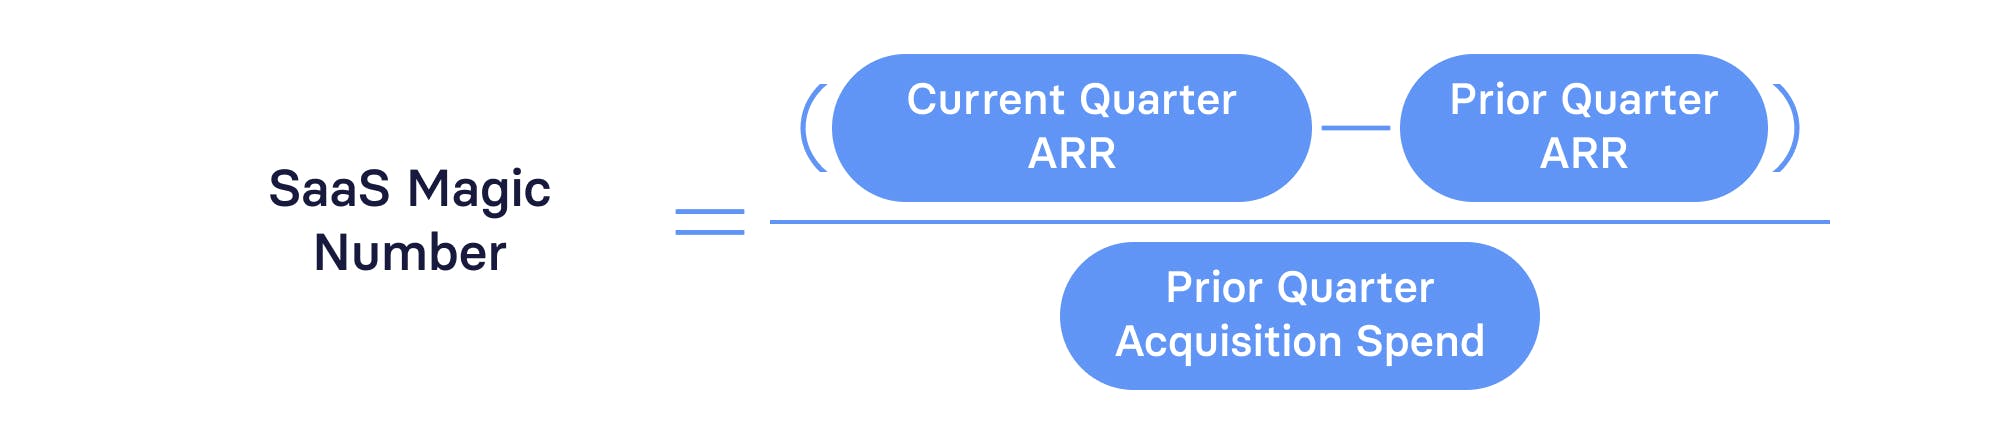
The SaaS magic number specifically looks at sales and marketing efforts to consider, “How much revenue do we generate for every dollar spent on customer acquisition?” To determine the answer, take your current quarterly ARR, subtract last quarter’s ARR, and divide it by last quarter’s cost per acquisition or customer acquisition cost (CAC).
If your average sales cycle occurs on a monthly or annual basis, you can substitute MRR or ARR.
The magic number prompts you to take a deeper look into your sales and marketing metrics to understand their processes and workflows. If the number is higher than 0.75, it’s a good time to invest in sales and marketing. And if the number is lower than that, it’s time for a deeper investigation. Other metrics, like gross margin, free cash flow, and runway will help determine if an investment makes sense.
In terms of operational efficiency, there may be opportunities to reduce sales and marketing costs with sales automation tools that promote outreach and automate follow-ups.
11. CAC Ratio
Your CAC ratio is the cost of ARR on a dollar basis. While there are many types of CAC ratio formulas, you can simply take your acquisition spend and divide it by new business and upgrades for a given period of time.

You must ensure that your sales and marketing expenses are fully burdened. Your acquisition spend includes cost-per-click (CPC) for marketing ads, referral costs, and any online advertising efforts that brought qualified leads into the sales funnel. These expenses also include marketing and sales reps’ salaries, as it costs the company time to respond to emails and present demos that get potential customers to sign.
A CAC ratio of less than one is very healthy for SaaS businesses.
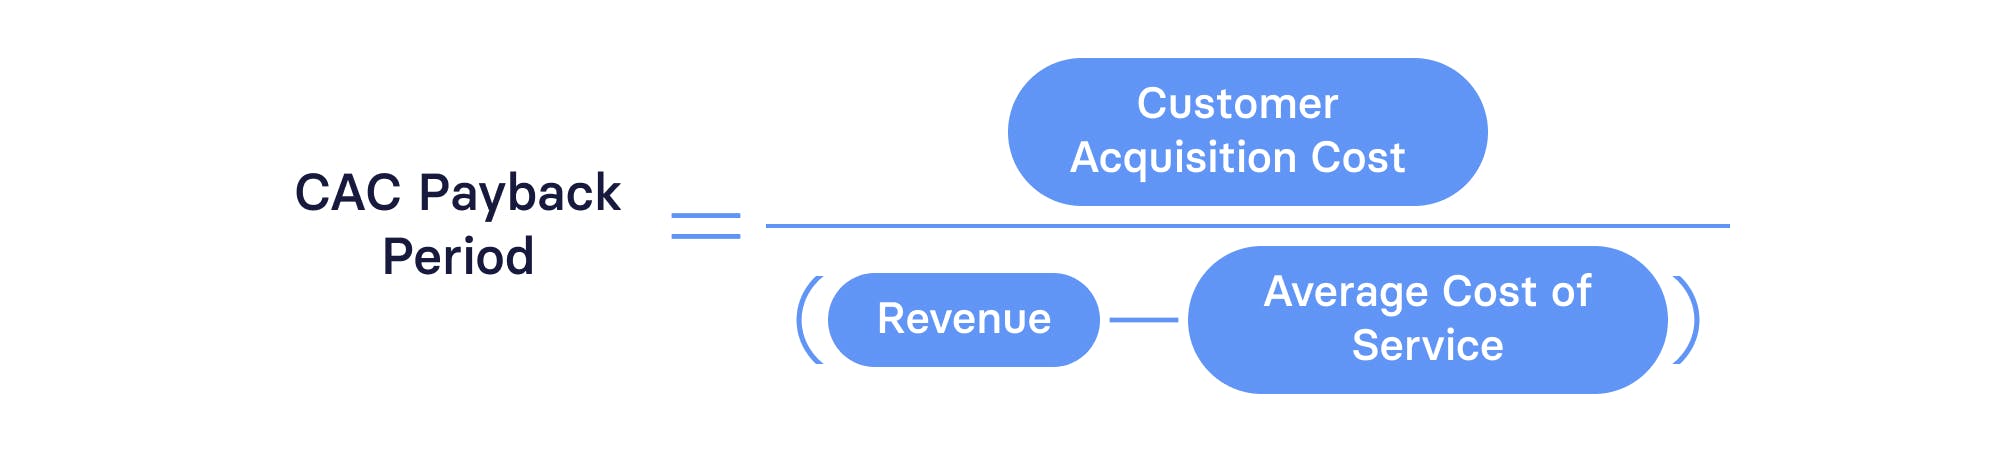
12. CAC Payback Period
CAC payback period measures the average time it takes for the company to recover acquisition costs per new customer. Just like with the CAC ratio, you want to ensure everything is fully burdened, from operational costs to campaigns.
To determine your CAC payback, take your CAC and divide it by the difference between your revenue and average cost of service (or simply substitute gross margin for your denominator).
You want to ensure your CAC payback factors in as much accuracy as possible, which is why you can conduct a customer cohort analysis and look at CAC payback on a dollar basis and logo basis to understand your customers on a deeper level.
In terms of efficiency, CAC payback is a great indicator of when customers become profitable for companies. It’s a touchstone for the sales and marketing departments to look at how to improve CAC, whether it’s through examining their onboarding processes or looking deeper at getting potential customers through the marketing and sales pipelines.
Get Insight Into Even More Metrics With the SaaS Metrics Cheat Sheet

When and How to Use an Operational Efficiency Dashboard
The best operational efficiency dashboard will give executive and departmental leaders timely, meaningful, and actionable insights into business performance.
You need access to operational metrics at all times because they impact everything from optimally timing your funding rounds to managing cash flow, extending your runway, improving customer satisfaction, and changing growth strategies to make the business more sustainable.
Taking advantage of finance automation and financial business intelligence to build your operational efficiency dashboard will streamline the process of data collection and aggregation from multiple source systems. They empower you to visualize and dive deeper into the data to ensure you can share your insights and collaborate with your business partners.
Mosaic is one solution that can help you get a better handle on your operational efficiency metrics and improve operational finance workflows. The Strategic Finance Platform allows you to build a custom Canvas or use a prebuilt Operational Efficiency Dashboard with the key metrics listed above.
All you need to do is integrate your source systems and then pull up the financial dashboard that already has these key financial metrics loaded and calculated for you. And with just a couple of clicks, you can dive deeper into the data to identify where operational efficiency can improve and bring your insights to the rest of the company.
Track Operational Metrics with Mosaic
Mosaic offers real-time updates and visibility, meaning you’ll always have the most accurate information available to you. You can easily toggle between monthly, quarterly, and annual views of the data, or add custom dates to study a particular period of time. You can also filter by any dimension, attribute, or grouping to dive deeper into customer behavior.
Mosaic’s 12-metric Operational Efficiency Dashboard template is just one of the many ways you can improve your operational efficiency – Mosaic has plenty more to offer.
Automate Metric Calculations, Save Time and Improve Workflows

Operational Efficiency Metrics FAQs
What is operational efficiency?
Operational efficiency refers to a company’s ability to build products, bring them to market, and serve customers in a way that is sustainable. Companies that focus on operational efficiency drive growth without over-extending their budgets.
What are operational efficiency metrics?
What is the difference between operational efficiency metrics and KPIs?
What is a good operating efficiency ratio?


Own the of your business.
