

SaaS may be one of the most difficult industries to benchmark performance in. Wide varieties of business models, pricing strategies, revenue drivers, and cost structures have historically made it almost impossible to set industry standards for performance and operational/financial efficiency.
That doesn’t mean SaaS benchmarking is impossible, though. You just need to be mindful of how your business aligns with those included in the data.
Getting a full understanding of your business performance always starts with understanding which metrics matter to the business, from department leaders’ interests to investors and board members. And then, once you have further input, you can use these insights alongside historical data to identify measures of success and areas for improvement.
Here’s how SaaS benchmarking helps you get a clear view of the company’s growth path and how to leverage plans and forecasts with benchmarks to truly benefit the business.
Table of Contents
What Is SaaS Benchmarking?
SaaS benchmarking is the comparison of performance metrics either around historical data within your company or across companies within the same industry. SaaS businesses strongly emphasize benchmarking around historical data due to the immense variables available to businesses, whether it’s the pricing plan or business model.
Looking at benchmarks gives business leaders context for the company’s historical growth and performance and helps department leaders develop realistic goals for improving their department’s performance as it impacts the company’s operational and financial efficiency.
When Ben Murray, The SaaS CFO, visited the Role Forward podcast, he referred to benchmarks as “strategic goalposts.” These goalposts are used to help determine what’s working and what needs improvement in each department so you can better collaborate with business unit leaders.
But how far these goalposts move back and forth relies on benchmark analysis that is relevant to the business and its needs. You’ll need to choose the right metrics to track, so you don’t get bogged down with irrelevant data.
SaaS Business Benchmarking Challenges
You may experience different SaaS benchmarking challenges depending on your stage of maturity. Seed and early-stage companies have a slight disadvantage because they lack historical data to see internal trends and averages across metrics. And more mature companies have to contend with increasingly complex operations that add nuance to every key metric.
Your expertise and visibility into business data are what can help leadership navigate the benchmarking process. But regardless of stage, there are a few common challenges you should be aware of:
Benchmarking against companies that are too different from yours
As you build historical data across the company, benchmarking against similar companies gives you a better understanding of performance, whether it’s in your unit economics, go-to-market motion, or capital efficiency.
Trying to benchmark against companies that are different from yours — whether in business model, price strategy, or revenue source — means you’re not getting an accurate view of how your business is actually performing. For example, if your business brings in customers at a $5,000 price point, but you’re comparing metrics to a company that brings customers in at a $100,000 price point, your comparison is already flawed.
Measuring too many metrics or the wrong metrics
SaaS metrics benchmarking provides a wide array of options, and figuring out which metrics matter short- and long-term is a vital step toward getting the full picture of your company’s performance.
Looking at metrics in isolation
Metrics don’t mean much in isolation. You need context to get at the “why” behind the numbers. While you’ll collaborate with department and executive leaders to ensure everyone is on the same page about what metrics to monitor, it’s up to you to weave the connections between metrics through financial storytelling.
Calculating metrics incorrectly
Metrics can only provide accurate information if they’re calculated correctly using the right data. Using the wrong calculation or excluding data gives you a twisted representation of the performance metric you’re trying to measure. Human error is always possible as you reconcile and manipulate data, so make sure the data is as clean and current as possible before diving into your metric calculations.
Choosing metrics based exclusively on external expectations
While you do have to take investors’ expectations into account, those expectations shouldn’t be the only deciding factor in what metrics you report on. Work with executive leadership to determine why some metrics take prioritization over others and determine at what stage you can introduce other metrics investors will be interested in.
Not gathering data efficiently or regularly enough
Calculating metrics properly requires clean data, which means constant manipulations and updates in various source systems. While finance teams may not be able to control the accuracy in the ERP, CRM, or other source systems, they can flag any inaccuracies as they gather the data.
There’s also an opportunity to forecast which metrics will matter and what the opportune rhythm for collecting that data may be, such as the month-end close process or prepping for board meetings. Make sure you have a regular data-collection routine and an efficient way to track and access that data so you can get to it when you need it.
Reporting on data ineffectively
Even if your data is clean, accurate, well-tracked, and calculated correctly, you’ll struggle if you don’t know how to present it and communicate it correctly. If stakeholders and other department leaders can’t make sense of the data you’re presenting, it’s not particularly helpful to anyone but you. Again, ensure that your financial storytelling skills are on point, and share your insights with your colleagues so that they can make the case for why certain data points and metrics become your foundational or North Star benchmark.
SaaS Benchmarking Examples
Knowing which metrics matter to the business is a large part of ensuring that SaaS benchmarking provides helpful information to drive the success of the business. The following groupings are frequently used by SaaS businesses to benchmark against.
Consider which groupings or metrics will give your business leaders the information they need to drive business performance.
Throughout the section, we’ll provide examples of benchmarks from the industry survey we sponsored with RevOps Squared and The SaaS CFO as well as other SaaS benchmarking surveys like the annual KeyBanc report and OpenView Ventures data.
SaaS Financial Metrics
These are the common metrics SaaS businesses measure to understand the health and viability of their operations from a financial standpoint. Common SaaS financial metrics include:
- Annual recurring revenue (ARR) growth rate (42%)
- Customer acquisition cost (CAC) (59% sales and marketing spend as a percentage of revenue for high-growth companies)
- Net burn rate ($625k median monthly burn at Series B)
- Gross profit margin (73% median across B2B SaaS)
Operational Efficiency Metrics
Operational efficiency metrics are very much dependent on the size and stage of your company. For example, Series A companies that are early in the sales process may weigh sales and marketing expenses with a heavier eye, while later-stage businesses will see this investment slide into place with other expenses as the customer base builds. Consider the size and stage of your company when deciding which of these metrics matters most for your business.
- SaaS Rule of 40 (42%)
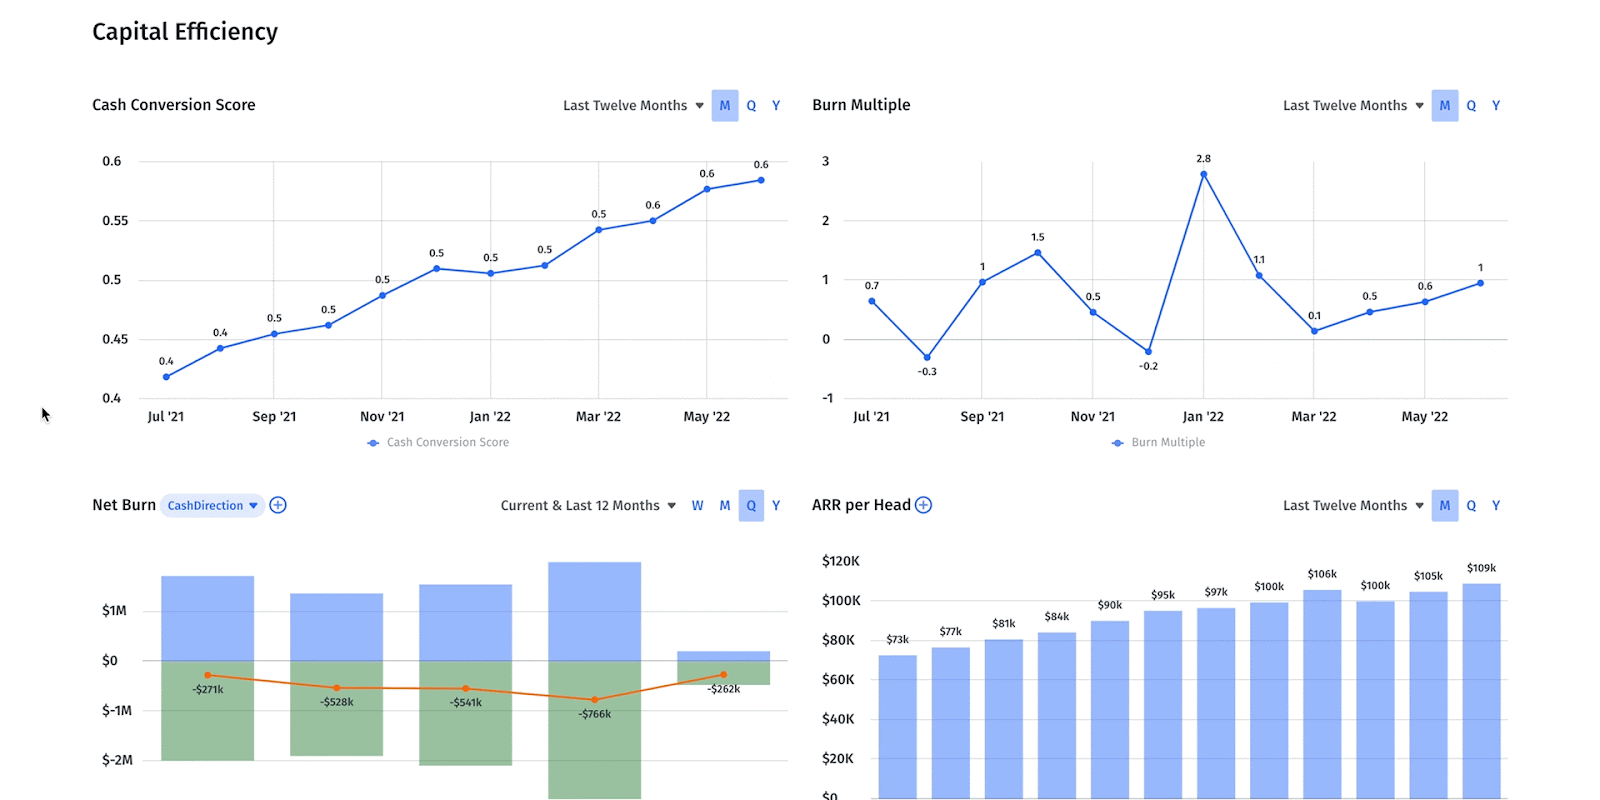
- Cash conversion score (1.0x+ is best in class)
- Burn multiple (1.6 median up to $10 million ARR)
- SaaS magic number (0.75 is the standard mid-point for investing in sales and marketing)
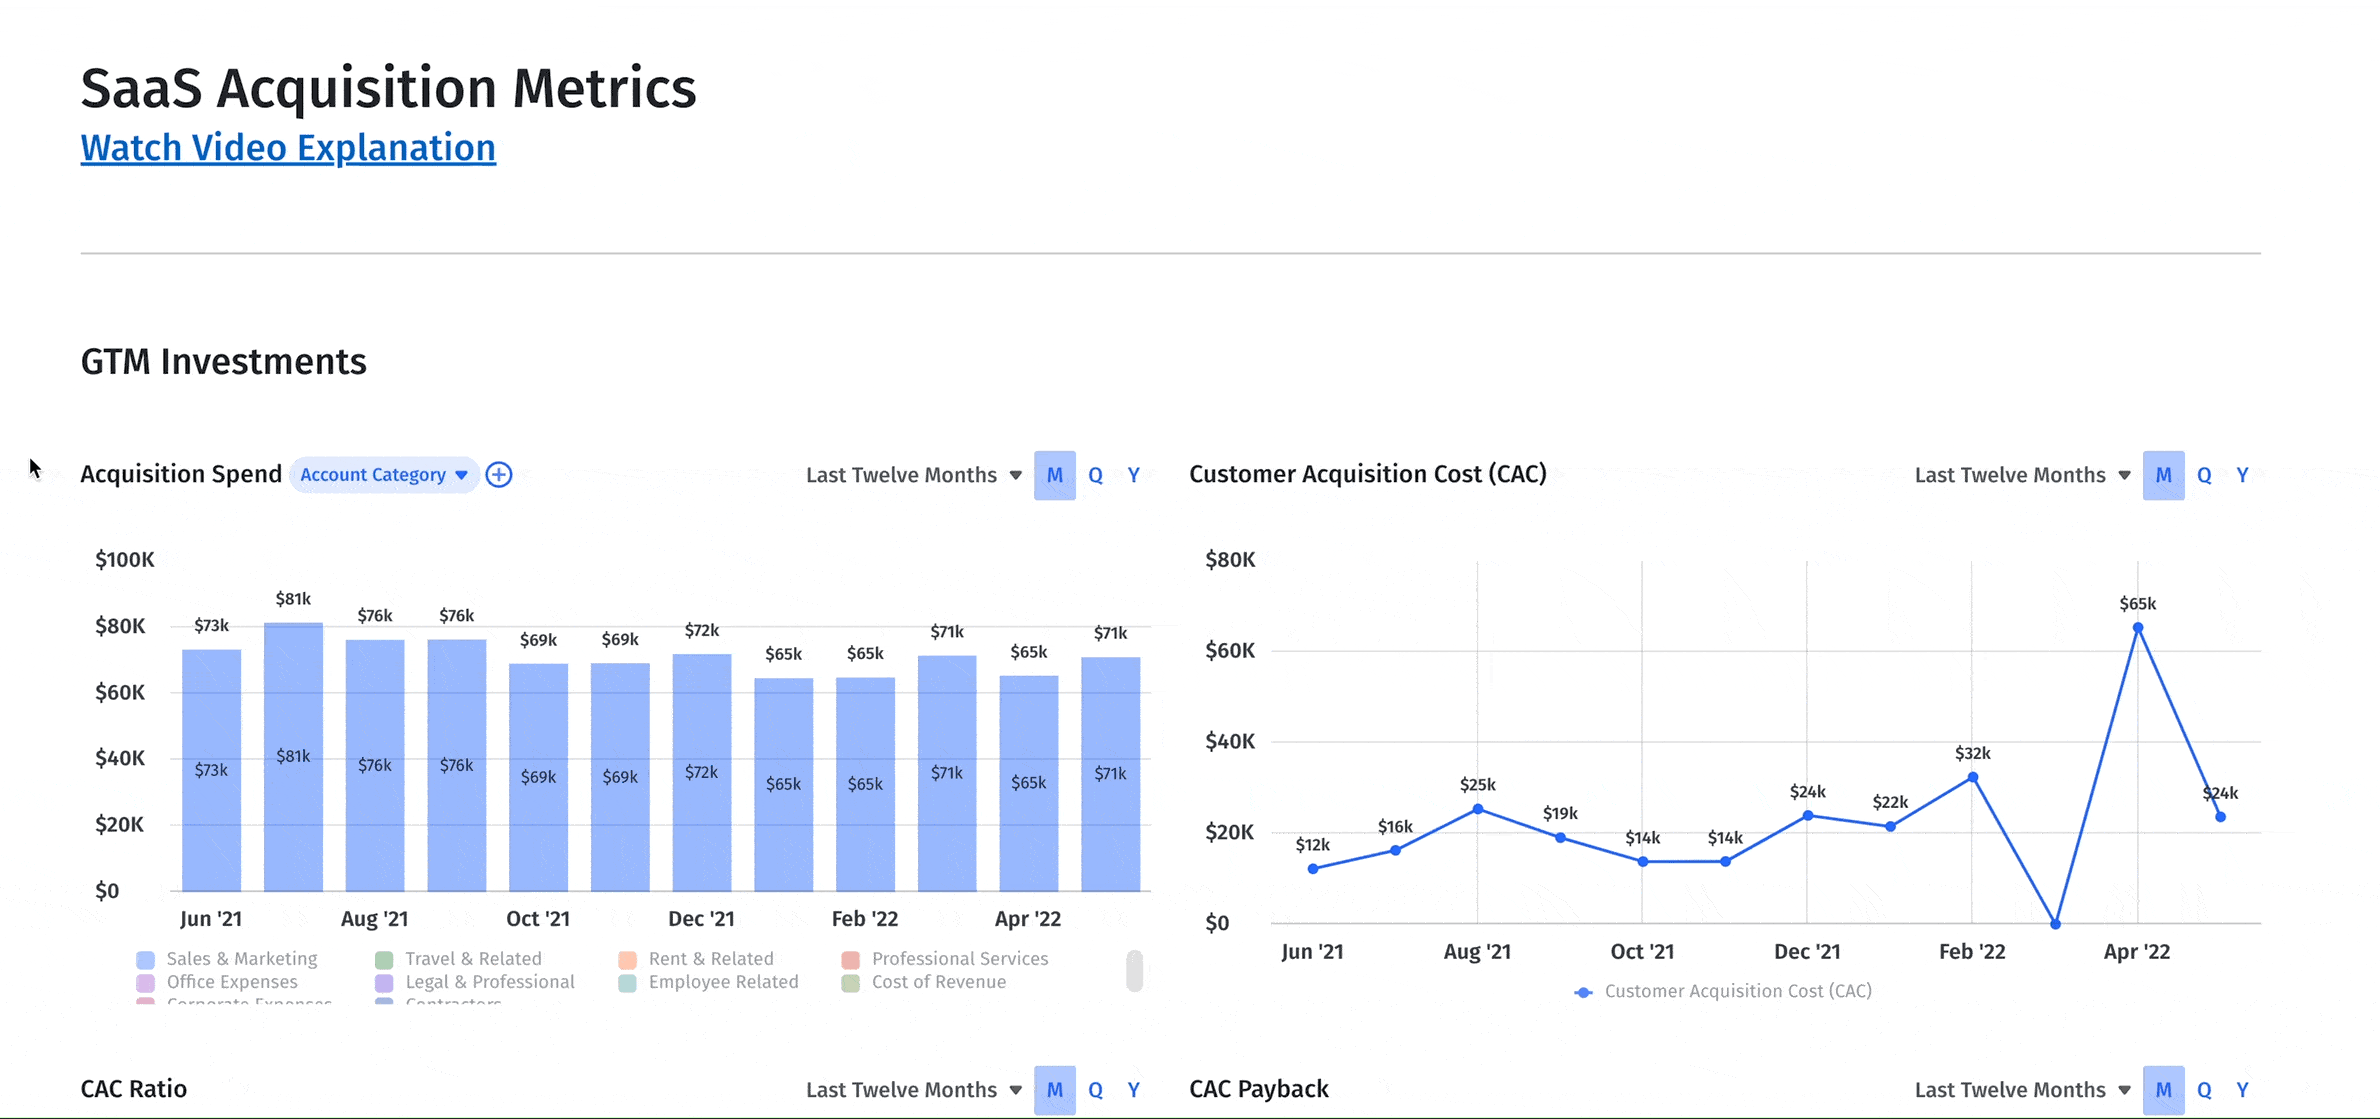
Customer Acquisition Efficiency
Customer acquisition metrics are extremely important for a SaaS business, regardless of stage. But sometimes CAC calculations may need to evolve as the company matures. Murray pointed out that for startups and early stage companies, most or all of sales and marketing expenses are going to customer acquisition. As the company matures, there are different ideal customer profiles (ICPs), so that may require a cohort analysis to determine the most accurate representation of CAC per ICP. The following are frequently the metrics that matter for tracking customer acquisition efficiency.
- New CAC ratio ($1.58)
- Blended CAC Ratio ($1.38)
- CAC Payback Period (16 months)
- LTV/CAC ratio (4.0)
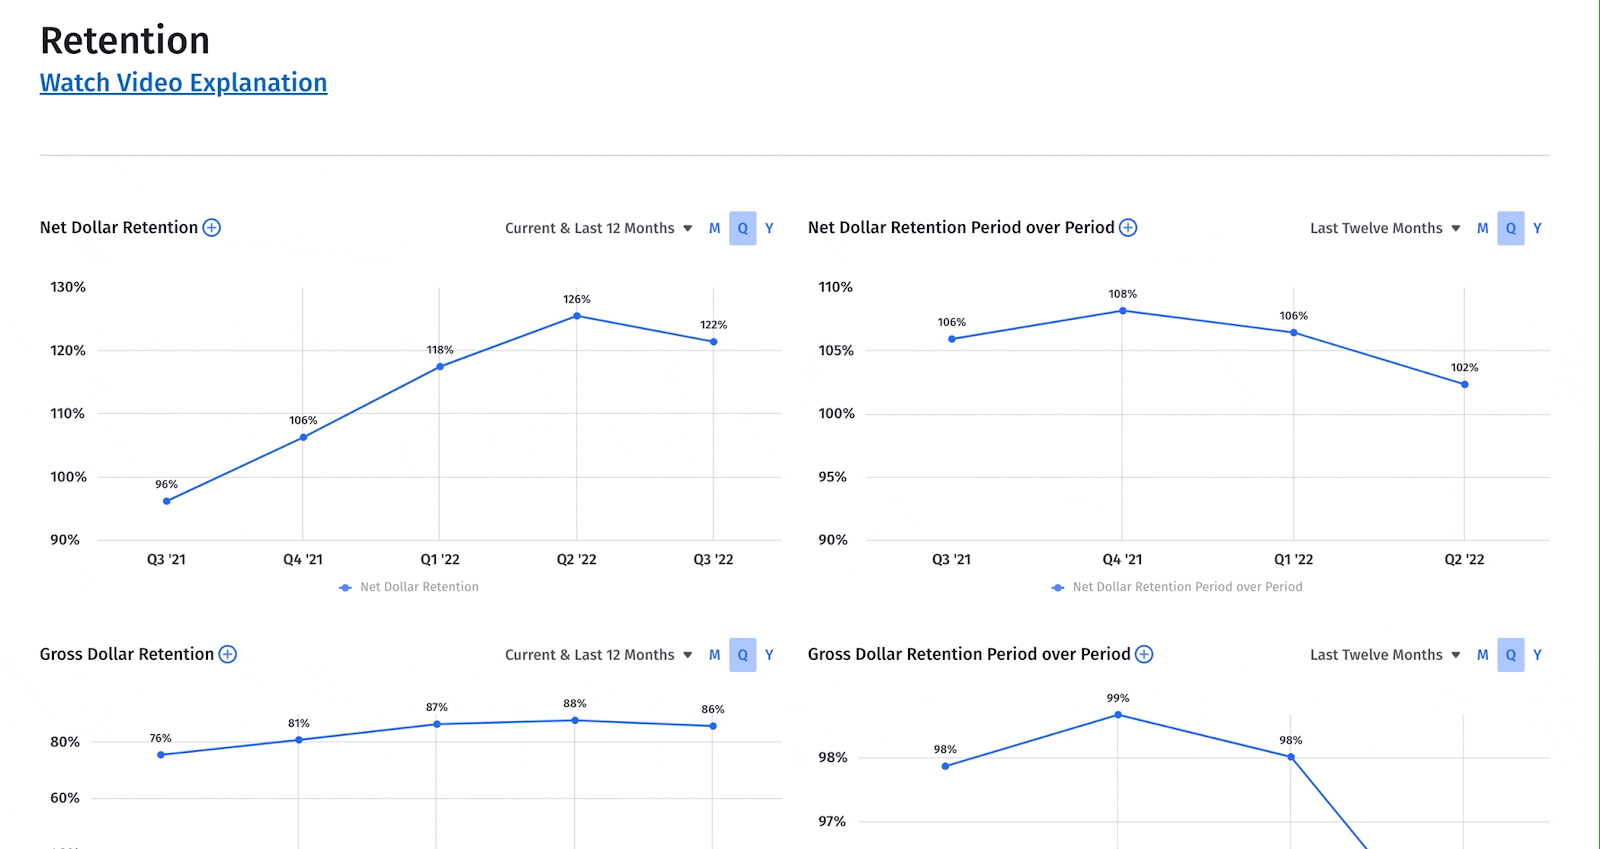
Customer Retention Metrics
Customer retention metrics are essential for SaaS businesses to measure retention versus churn. Digging into the “why” behind the metrics that analyze customer retention and churn provides valuable insight into customer success and the health of the business. And, since customer retention cost is significantly less than customer acquisition cost, getting insights into customer retention can significantly benefit the business. The following metrics can offer the insights you need.
- Net revenue retention (105%)
- Customer lifetime value (LTV) (no benchmark)
- Logo retention rate (85%)
Customer Expansion Metrics
Retaining customers is more cost-efficient than acquiring new ones, so continuing to make revenue from them is beneficial, too. Examining customer expansion benchmarks helps give insight into how to upsell and increase revenue via expansion. Customer cohort analysis here is especially helpful. Looking at both new customers and existing customers also provides insight into overall customer engagement and satisfaction. The following metrics that track ARR growth are particularly valuable here.
- Gross revenue retention (87%)
- Expansion ARR to total growth ARR (30%)
Capital Efficiency Metrics
The metrics in this group offer interesting insights into a company’s revenue growth and efficiency, although other metric groupings provide better and more valuable insights for investors and operators to drive operations. As such, these metrics are typically paired with others to get a complete picture of business performance.
- Revenue per employee ($218k)
- ARR to capital ($1.09)
Get The 10 SaaS Metrics You Didn’t Know You Needed

Selecting Your SaaS Benchmarks
Choosing the right SaaS metric benchmarks for your business can feel overwhelming, given the volume of metrics available. But trying to track too many is counterproductive, given the day-to-day responsibilities alongside monthly and quarterly reporting duties. The key is to track benchmarks that make sense for the unique needs of the business so you can get the most from benchmarking.
Eventually, you’ll have enough performance data to benchmark against your own historical data to track your performance. But it takes time to build a complete metrics set and you won’t have the benchmark data you need overnight. So, you’ll initially need to benchmark against other businesses that are similar to yours. When you’re looking for comparable business profiles to benchmark against, pay attention to the following company characteristics.
Size and Stage of the Company
Your SaaS growth stage will change the business, which will change the benchmarks you care about over time. SaaS startups will have very different benchmarks from IPO companies, so be prepared to adjust the benchmarks you track as the business matures.
Type of Company and Business Model
The metrics you need to track may change depending on how your business makes money and how your business defines successful customer retention. Monthly apps will track different metrics than an annual service, for example.
Average Annual Contract Value
One SaaS company may have an annual contract value of around $20,000, while another may have an annual contract value of $90,000. Comparing these two SaaS companies doesn’t make a lot of sense because their needs and goals are different.
Product/Service Type and Distribution Model
One-off services are very different from services that expect repeated use and recurring revenue from customers. Similarly, the way your customers access your product or service makes a big difference in the types of metrics that will be important to the business.
Target Customer and Go-To-Market Strategy
B2B SaaS businesses have a significantly longer and more complicated sales funnel than a mobile game business, for example, so sales efficiency will be measured differently. The type of customer base the business targets will also alter the metrics that matter to your company.
How to Report On and Review Benchmarks in SaaS
The benchmarks you track should be in line with your proactive strategies for driving business performance. The insights you get from benchmarking inform strategic decision-making throughout the year for improved performance over time.
According to the 2022 SaaS Benchmark Survey Report, your CAC payback period has grown into a fundamental SaaS metric to benchmark against because need to know how long it’s taking the business to accrue the CAC back. But to get the most out of this metric and its benchmark potential, you need to be looking at companies with a similar ACV, distribution model, and go-to-market strategy to ensure that you’re getting an accurate comparison.
In the same Role Forward episode mentioned earlier, Murray suggested looking at your CAC profile for the full picture. That can include metrics like gross and net dollar retention, the SaaS CAC ratio, the SaaS magic number, and LTV:CAC ratio.
Looking at the examples below, you can see that benchmarks are grouped by ACV, but you’ll also want to look at customer profiles and cohorts as you track this metric for your business. Some businesses may opt to track these metrics by ARR as well. Most importantly, looking at these metrics in conjunction with other related metrics over the course of several sales cycles gives you the best view of the company’s sales team and customer acquisition efficacy, and customer retention.
While historical data takes time to build, measuring these metrics and then accumulating that data to form a benchmark is a formative process for the company’s growth. The data you share in your benchmark report needs to be easily understood and processed by your board, stakeholders, and business leaders, so ensure that you present this data that leads everyone toward actionable insights and strategies to improve performance.
Driving Benchmarking Conversations with Mosaic
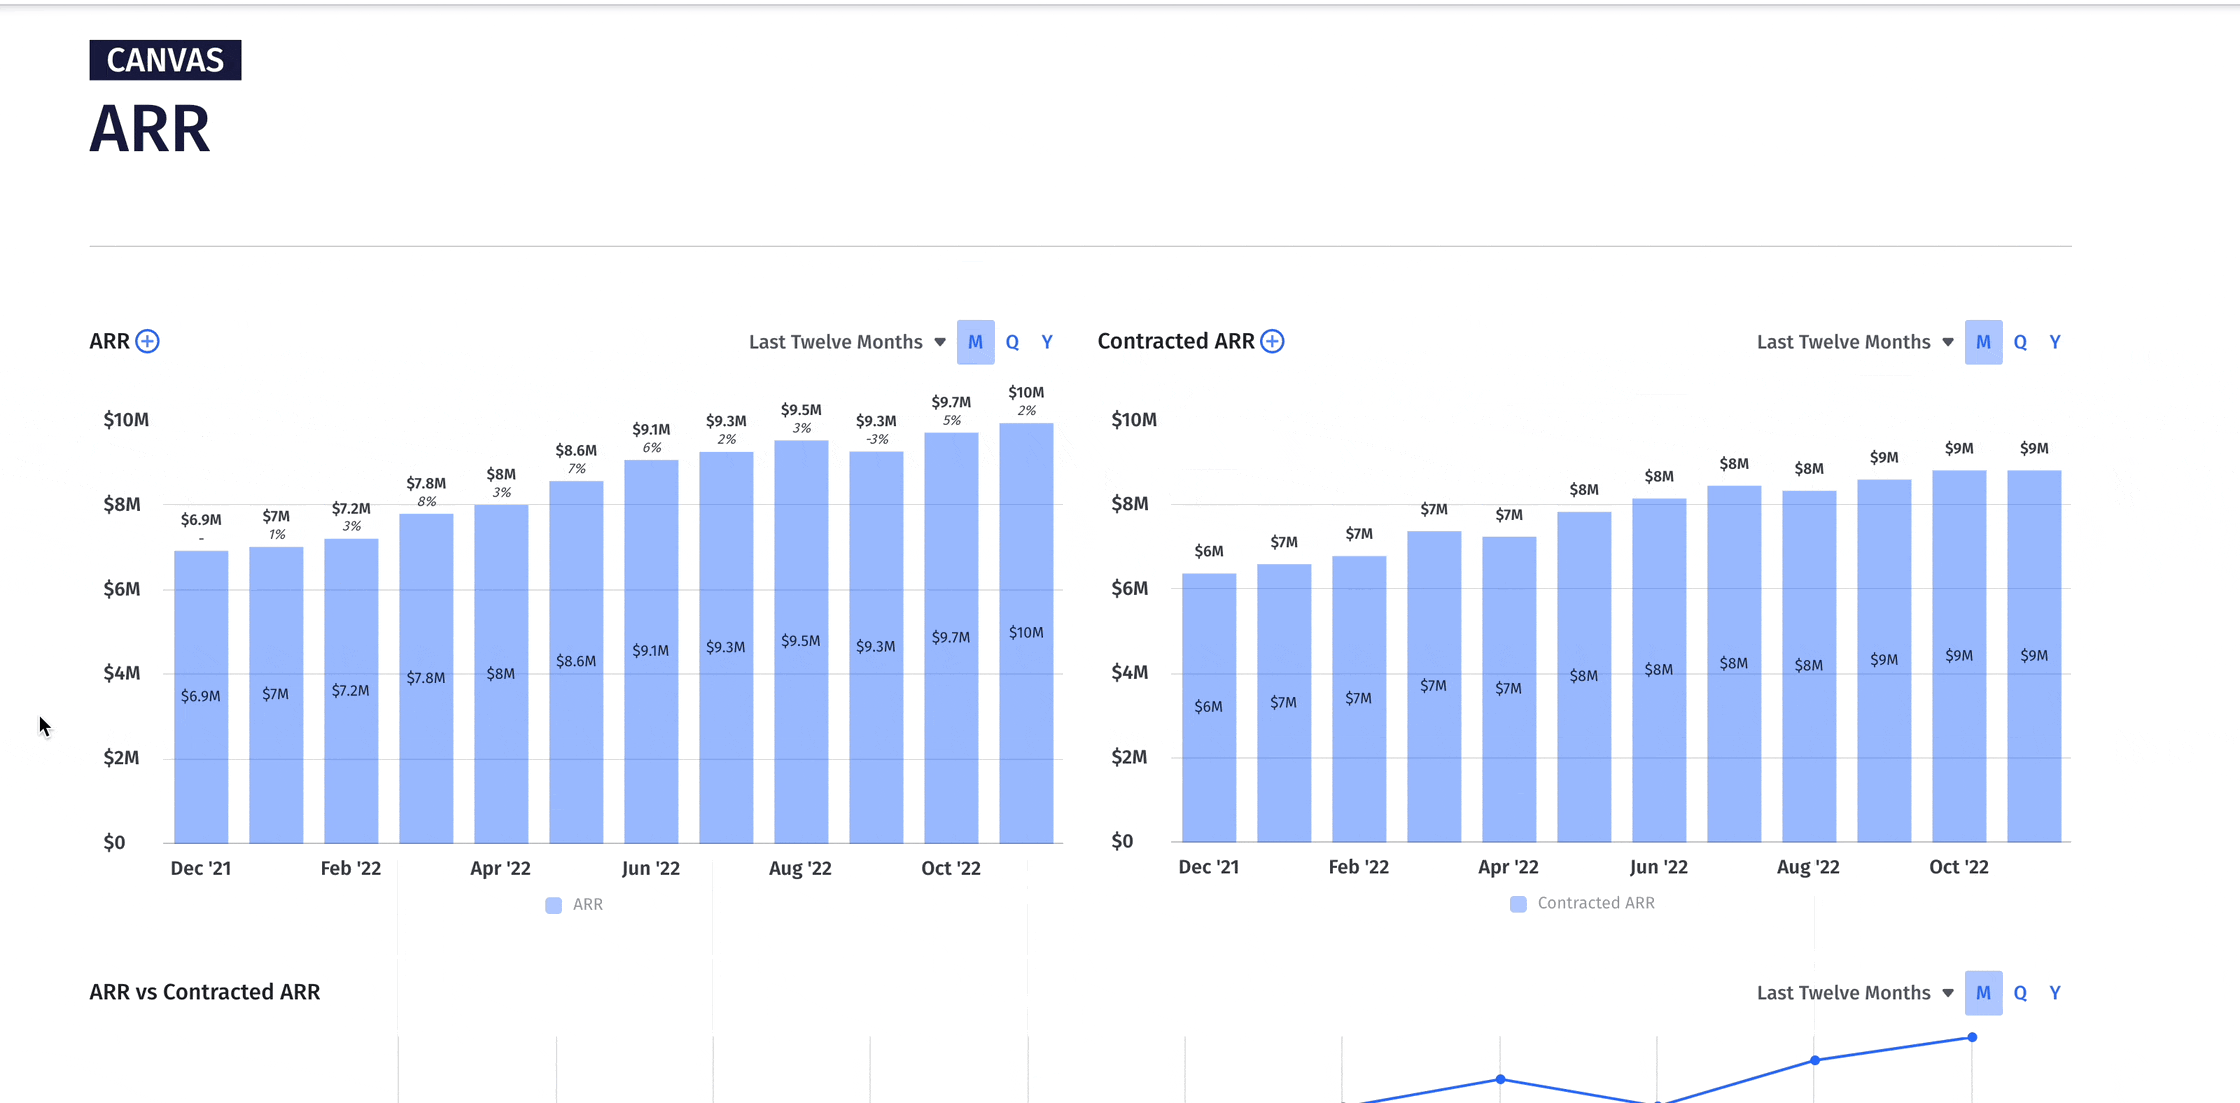
Context matters. Benchmarks are best viewed in groupings that give a more holistic view of the company’s performance. Ideally, your source systems work together to provide you with overlapping data sets for the most accurate, comprehensive story of your company’s finances. A thoughtfully constructed SaaS benchmarking dashboard brings the metrics that matter to life, providing the context and insights you need to analyze your data effectively.
With Mosaic, you can not only track and access your data in real time, but you can also customize your SaaS dashboard to meet your company’s needs, no matter what stage of growth your business is in. Once your dashboard is set up with the metrics you want, you’ll have an indispensable tool to help executive leadership drive benchmarking and deliver actionable insights. Customize your dashboards by prebuilt groupings, such as the operational efficiency or retention metrics dashboards above, or create your own unique dashboards to reflect the metrics that matter to the business.
And to jumpstart your SaaS metrics benchmarking analysis, read the 2022 SaaS Benchmark Survey Report, then see how you rank among similar businesses. You can make a company profile to gather important information and insights to help you take full advantage of Mosaic’s prebuilt SaaS dashboards or to help you build a custom dashboard with the metrics that matter to you.
Once your financial dashboard is ready, you can benchmark against comparable businesses — and, more importantly, against your own data, to discover how your financial and operational metrics stack up. This will help you optimize your metrics over time for better financial storytelling and help business leaders develop proactive strategies for improving the company’s performance.
Get a personalized demo of your customized dashboard today and find out how Mosaic can help drive accurate benchmarking with the context you need to get the full picture.
Build Customized Financial Analytics Dashboards

SaaS Benchmarking FAQs
What is a SaaS benchmark?
A SaaS benchmark is an industry-standard that can offer “strategic goalposts” to help businesses determine what’s working and what’s not when it comes to the company’s performance. Benchmarks are set around a company’s historical data alongside available competitor information.
What are common SaaS benchmarks?
What is the Rule of 40 in SaaS?


Own the of your business.
