Churn Rate
What Is Churn Rate?
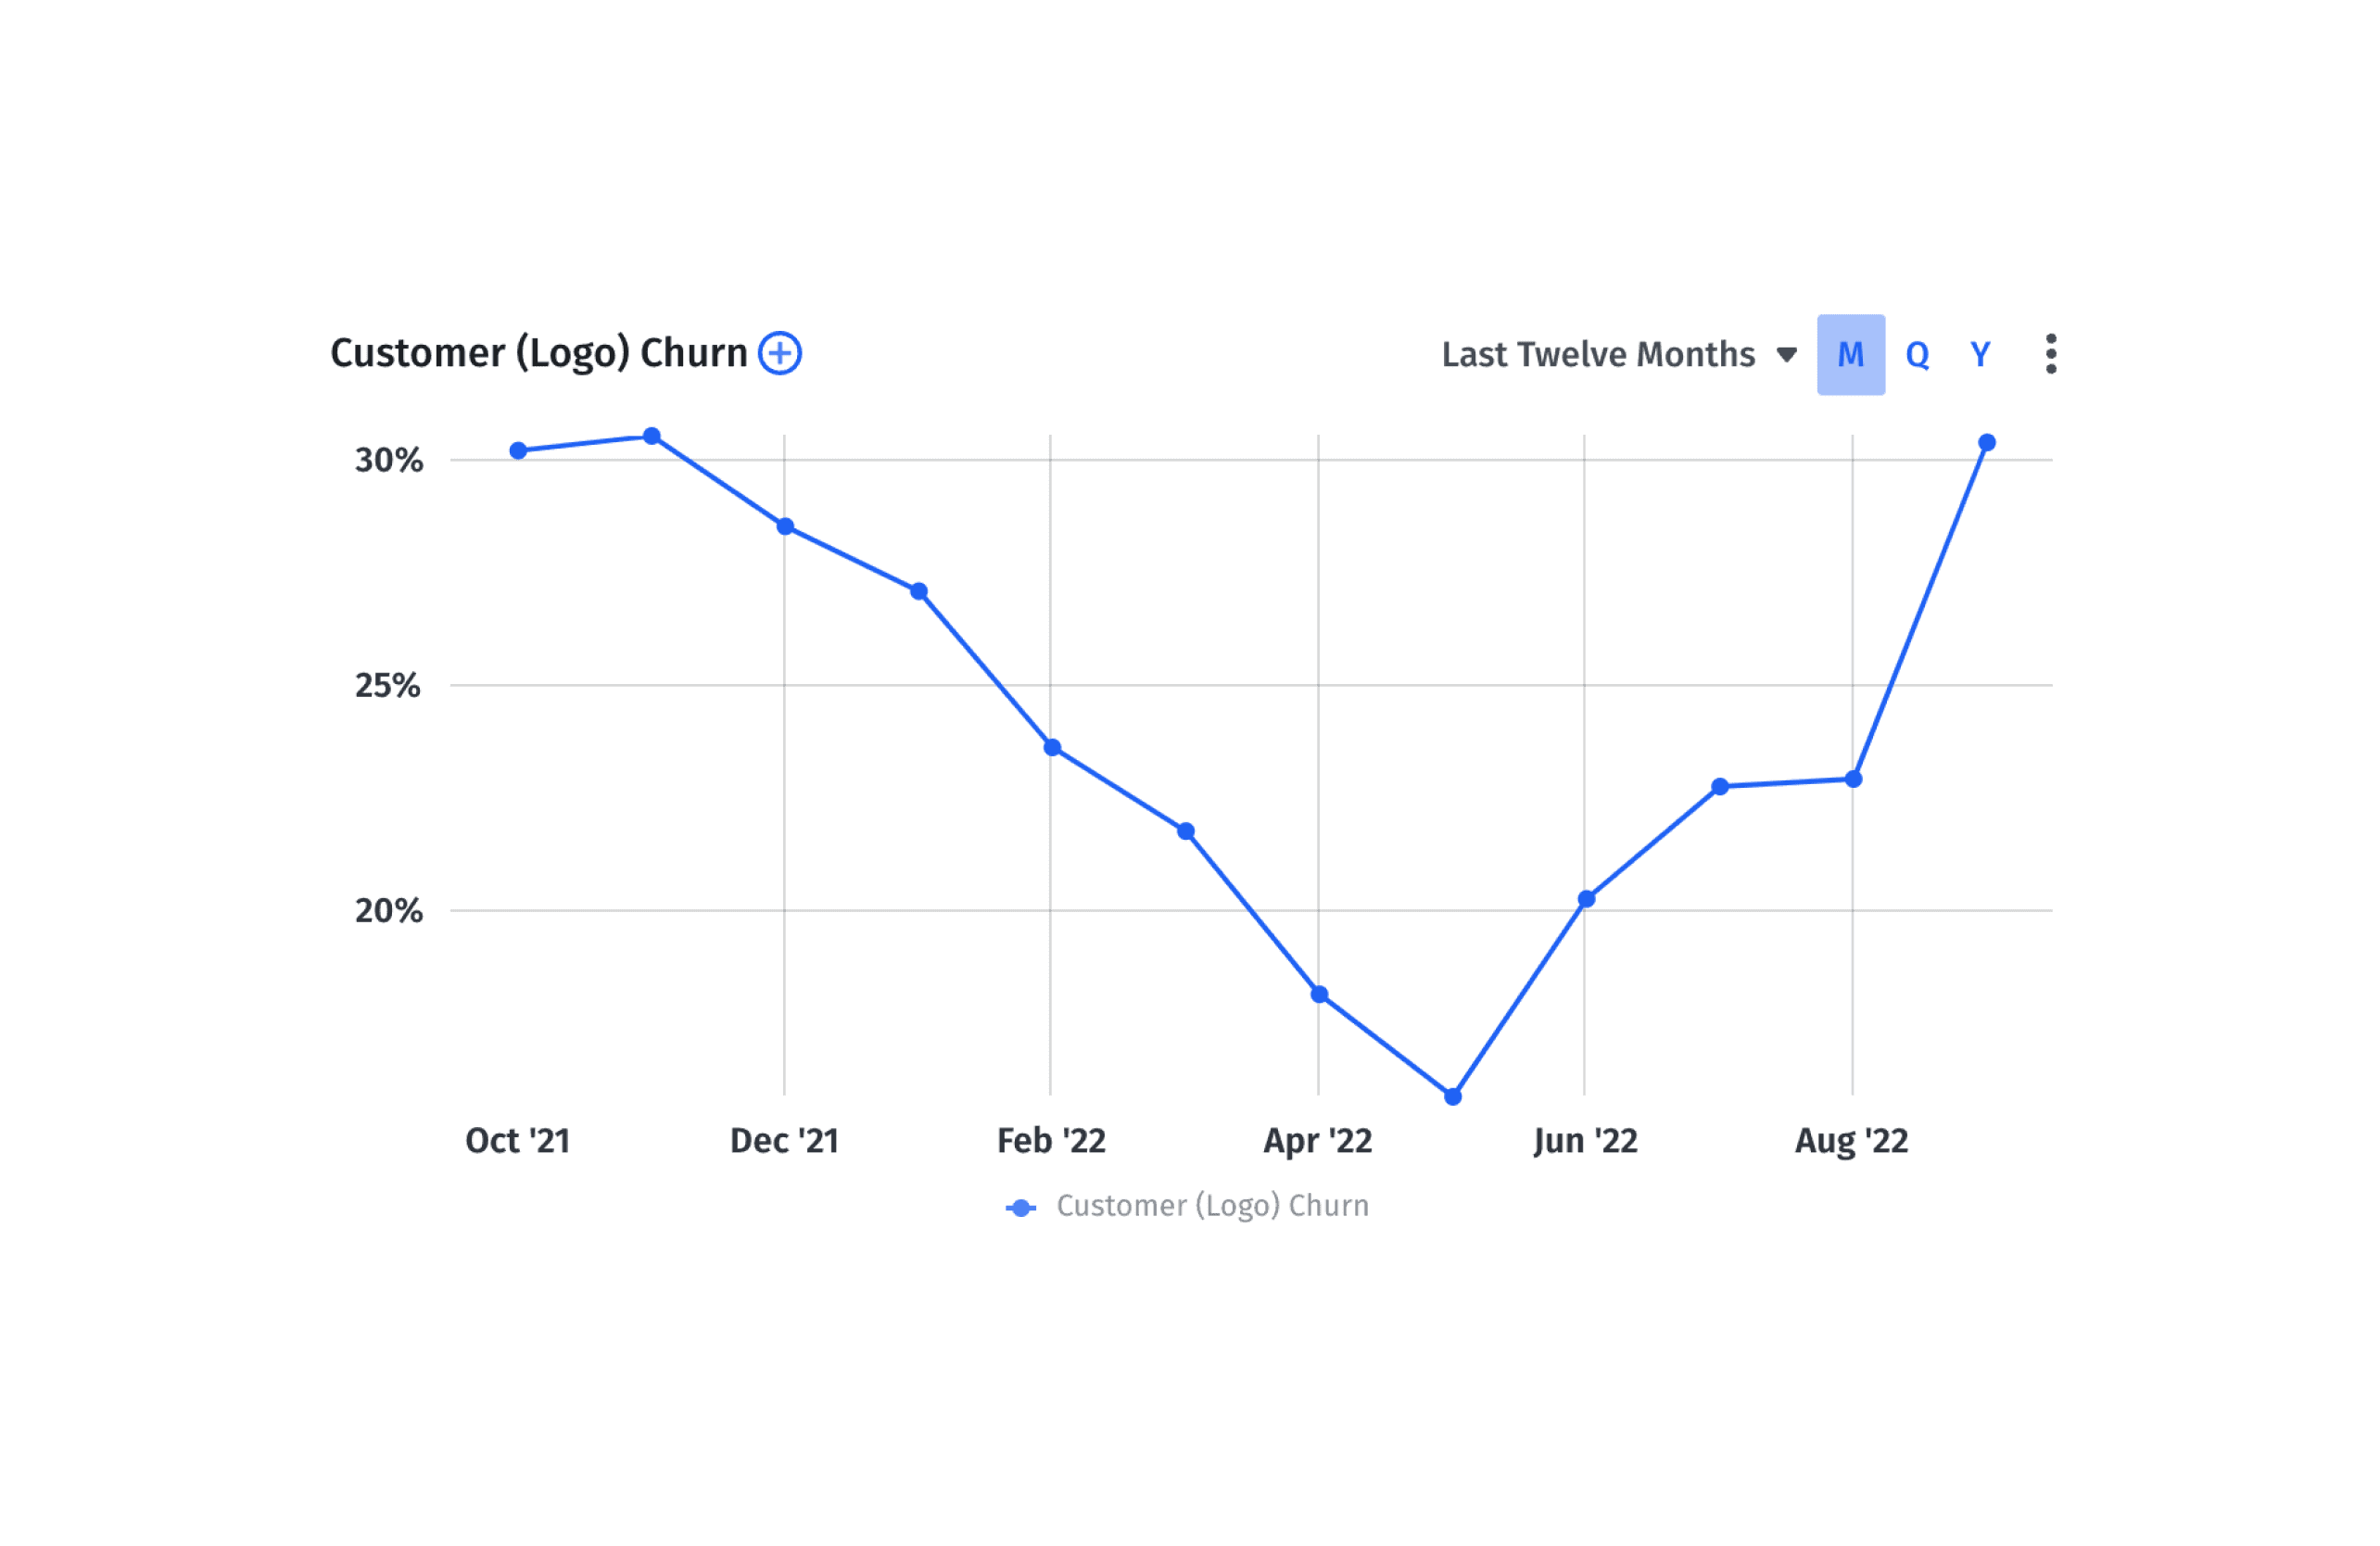
Churn rate is the rate at which your business loses customers or subscribers. Also known as customer attrition or logo churn in SaaS, churn rate is shown as a percentage over a specific period of time.
For example, if you had 100 customers at the beginning of the year, and lost 8 customers by the end, you’d have an annual churn rate of 8%.
Churn rate is especially important for subscription businesses because they depend on recurring revenue. You’re always going to have some level of churn. The goal is for finance to collaborate with customer success to keep churn as low as possible, especially in the customer segments that create the most value.
Categories
Table of Contents
Why Is Churn Rate Important?
For SaaS companies, churn rate is an indicator of the quality of your service and how well you’re meeting customer needs.
Understanding churn rate helps you better understand your customer base. If your churn rate is high, you may need to tweak your product’s features to better fit your ICP or adjust prices. If it’s low, you can rest assured you have a good product-market fit.
Since churn equals lost revenue, understanding your churn rate provides a clearer view of your cash runway and the path to profitability. For finance, getting a handle on churn rate also helps you understand likely renewals and build more accurate revenue forecasts.
But to really understand churn in your company, finance needs to dig into the details, examining churn by product line, customer segment, service level, etc. When you can see where and when in the customer lifecycle churn is happening, customer success can investigate why and take proactive measures to boost your retention rate, or alert your sales team to target a better customer segment.
How To Calculate Customer Churn
Customer churn, or attrition rate, shows the number of customers who stopped doing business with your company over a given period of time.
To calculate customer churn, first decide which period you want to evaluate (a month, a quarter, or a year). Next, determine the total number of customers you had at the beginning of the period and the number you had at the end of the period.
The customer churn rate formula is:
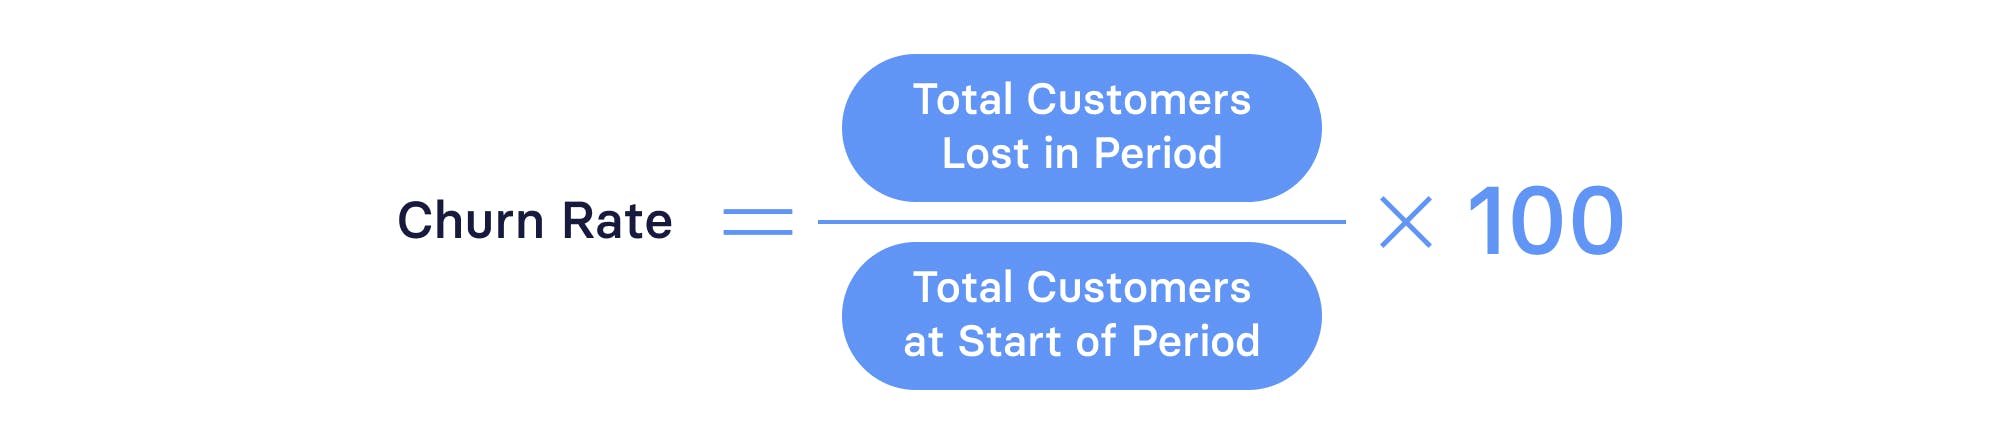
As an example, say you had 80 customers at the beginning of the quarter and you lost 4 over the period:
(4/80) x 100 = 5%
In this case, you’d have a quarterly churn rate of 5%.

Churn Rate Calculator
Your Churn Rate
0%
What’s a Good Churn Rate?
For SaaS businesses, the churn rate benchmark is around 5-7% annually. This means your monthly churn rate should be less than 1%.
But you’ll also want to contextualize the 5-7% number by looking at other SaaS companies with similar annual contract values (ACVs.
Your business model matters here, too, so look at historical data when considering an acceptable churn rate for your company.
Get the 2023 SaaS Benchmarks Report

Interpreting Your Churn Rate
Churn rate tells you a lot about your business.
A low churn rate means you have a strong product-market fit. A high churn rate could mean a lot of things. You might have customer satisfaction issues, need for new features, misguided customer success efforts, or misalignment between product and target customer.
To lower churn, finance and customer success must collaborate to investigate churn and devise solutions.
Analyzing Your Churn Rate
Churn rate on its own is important. But it’s also a very general metric — understanding you’re losing 5 customers per quarter doesn’t tell you much on its own, other than that something’s wrong.
But what is that something? To get to the bottom of this, you’ll need to analyze churn on a deeper level. The first step to churn analysis is segmenting customers.
Segment Customers
What kinds of subscribers are you losing? SMBs? New customers? Customers using specific product lines?
You’ll need to segment your customer base to answer these questions. You might need to segment by size of the business (enterprise, midmarket, or SMB), how long they’ve been a subscriber, product line, or region.
Once you have customer segments laid out in front of you, you can dive into the churn details with tools like customer health score and cohort analysis.
Leverage Customer Health Score
A customer health score (CHS) is an excellent starting point for investigating what types of customers are churning and why they’re churning.
Usually confined to the customer success department, CHS is a score that shows how likely a customer is to churn or renew. The higher the score, the more loyal the customer and the more use they’re getting out of the product. The lower, the more likely customer success will soon be conducting an exit interview.
But finance can use it too. If you see a specific customer group — say, customers using a specific product — has a low health score, you can direct customer success teams to put out the fires of potential churn and inform your R&D teams that there might be an undeyling issue.
CHS is also one way finance can quickly identify new customers who aren’t using the product. If you can get to the reason they aren’t using your product, customer success can address it before they churn. CS teams may need to explain use cases for your high-value features. Alternatively, they might need help getting the product — perhaps you need to rethink your service levels.
Where churn rate is a lagging indicator, CHS is its more proactive cousin, helping you spot and reduce churn before it becomes a historical fact.
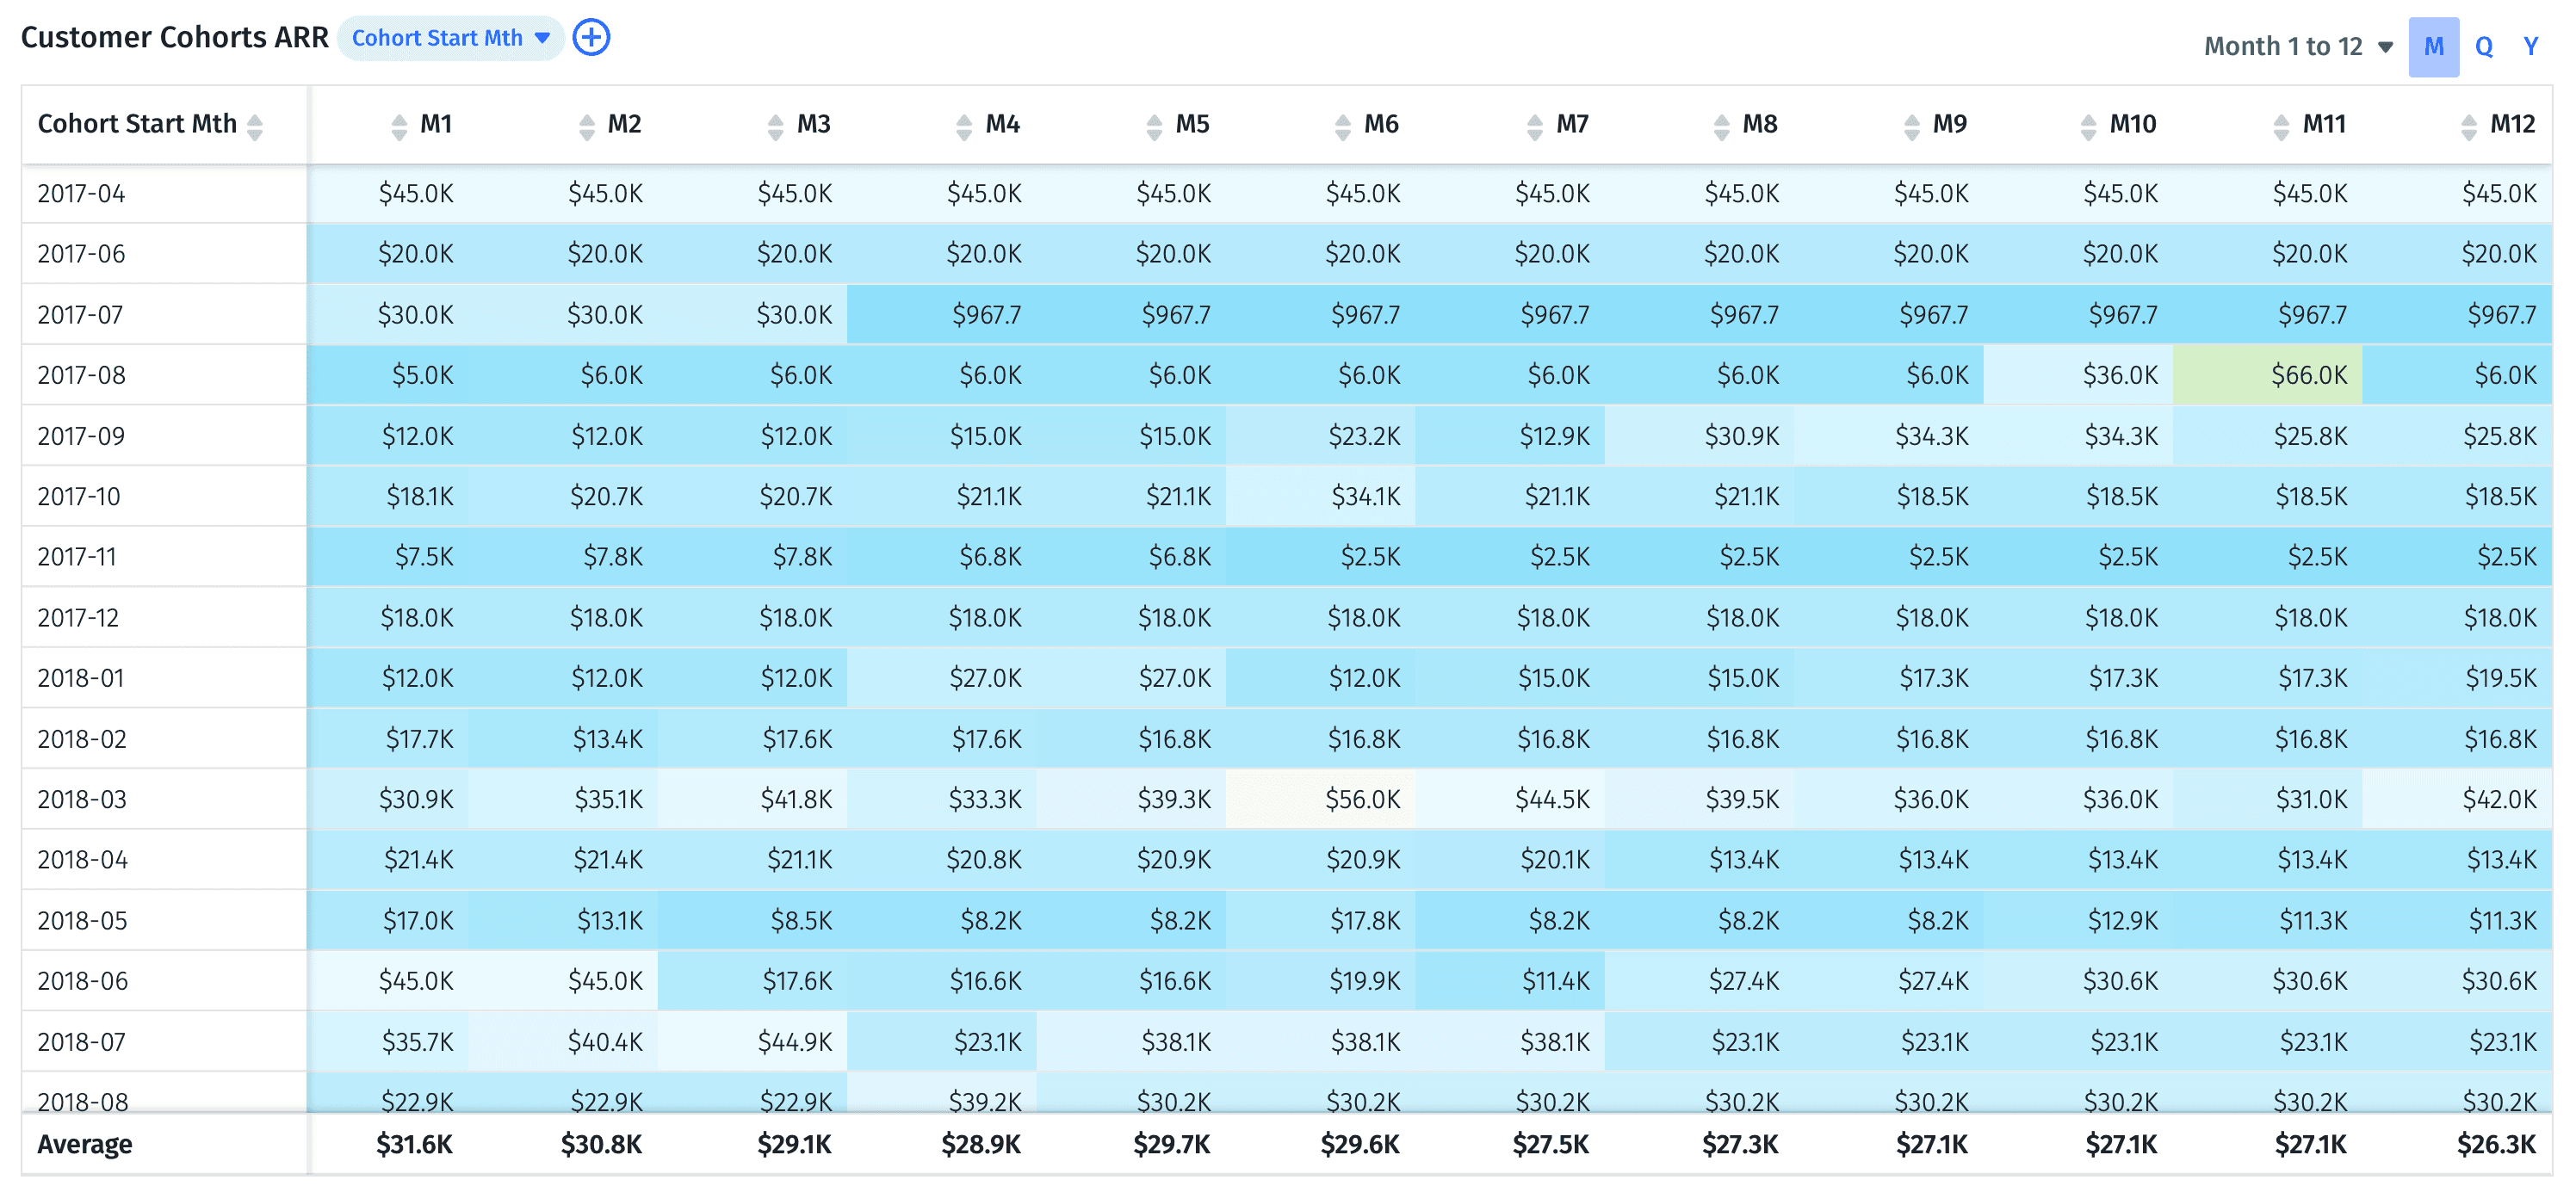
Think Outside the Box With Cohort Analysis
By integrating with your enterprise software, Mosaic provides an interconnected view of different components of your business. This interconnectivity allows you to analyze churn in a deeper way, uncovering sources of customer attrition that may not be obvious.
For example, using Mosaic you can cross reference churn rate with customers by ACV, industry, segment, or size. When conducting an analysis like this, you might find a cheaper plan has a higher churn rate, or a specific company size might not take full advantage of your offering and isn’t cost effective, and can be ignored or removed from your targeting.
You can also investigate if there’s a link between churned customers and specific AEs. If there is, those AEs could be misrepresenting the product, or selling to the wrong vertical.
Cohort analysis helps you dig deep, identifying at which point in the customer lifecycle clients find the most value, and at which point they start to churn. For instance, maybe a cohort that was recently onboarded is churning during the fourth month. Were they onboarded with a specific service tier, or subscribed to a specific plan? Investigate any commonalities across cohorts to reduce churn.
Cohort analysis also allows you to dive into important retention metrics like net revenue retention across customer segments.
For example, the SaaS benchmark for NRR is 120%. This number indicates you’re retaining all existing customers, while also expanding revenue through upsells. With cohort analysis, you can dig into customers who are at less than 120% NRR. From there, you can execute retention strategies that help you achieve negative churn — a highly-desired situation in SaaS where you no longer need to bring in new customers to achieve revenue growth.
Forecasting net revenue retention also helps you build better revenue forecasts. Say you see ARR decreasing in a certain segment. Because of this, net retention is at 85%. You forecast next year’s ARR based on that net retention, which you can then apply to the renewal rate for that year.
By looking at LTV/CAC ratio by cohort, you can identify which customer segments are the most sticky and who you should be advertising to to get the highest ROI.
Mosaic’s CFO dashboards can help you understand metrics like CAC, net revenue retention, and LTV in context, quickly identifying where churn is highest across customer segments and plugging up leaks.
Strategies for Reducing Churn Rate
Keeping churn rates as low as possible ultimately falls to customer success. But that doesn’t mean finance can’t play an active part in customer retention. To get started, here are some possible solutions you can recommend to the customer success team if churn is high:
- Begin renewal conversations at least 90 days before renewal
- Conduct executive business reviews, where CS explains unique value proposition and demonstrates product ROI
- Gain customer feedback with net promoter score and CSAT
- Build a customer health score system
- Reach out to customers proactively
- Conduct exit surveys to find the cause of cancellation
- Assess customer support first contact resolution rate
Churn is usually highest in newly-acquired customers, so it’s important to scrutinize your onboarding process. Walk new clients through initial set-up with a clear, progression-based checklist. Make sure they understand the product’s most important features and how to use them. Build online tutorials and host webinars that show specific use cases.
Finally, note that some churn can be involuntary. Involuntary churn occurs, not as a result of customers disliking your product, but mechanical issues like credit card declines or out-of-date payment gateways. To avoid involuntary churn, make sure billing systems are properly integrated with your CRM, and payment gateways are up-to-date. You can also automate pre-dunning emails to avoid declined payments.
Enhancing Product Offerings Based on Churn Insights
Using Mosaic, you can analyze churn by product line.
If you see churn is high in a specific product, the first thing you’ll want to do is conduct postmortems with customers.
If the issue was missing features, you may want to investigate adding them. But you also have to balance that cost against the worth of the product line to your business — if it’s a product that only 10% of your base is using, with a low contribution margin, those product development costs will be better spent on your flagship product.
There’s a lesson here: you don’t always want to be tweaking your product offerings based on a small group of customers. What’s more important is to find your core customer base — those with the highest potential customer lifetime value — and focus on their needs. No need to be a jack-of-all-trades in the SaaS industry — find what you do and do it best!
Turning Churn Rate Insights Into Action
Churn rate is one of the most important metrics for guiding SaaS company strategy. It tells you if you need to adjust product-market fit, better communicate your message to customers, or rethink customer success tactics.
The problem? Churn rate is a lagging indicator. While it’s useful to understand why customers churned after the fact, ideally, you want to tackle churn before it happens.
This means tracking churn in real-time, becoming aware of the customer segments that are an issue with customer health scores and cohort analysis, and taking action.
But, calculating churn rate across spreadsheets is time-consuming. By the time you recognize where it is and why it’s happening, it’ll most likely be too late. By integrating with your CRM, Mosaic calculates churn for you and allows you to track it in real time
You can then slice and dice customer churn and related metrics like NRR by product line, service level, and size of the business, identifying and tackling churn at its source. Request a demo to see Mosaic in action.
Churn Rate FAQs
What is a good churn rate for SaaS companies?
The churn rate benchmark for SaaS companies is 5-7% annually. That’s less than 1% monthly. For a benchmark more suited to your business, however, look at companies with similar ACVs.
How does Mosaic help in tracking and analyzing churn rate?
What strategies can reduce churn rate effectively?
Explore Related Metrics


Own the of your business.
