

Budget variance analysis should be a critical tool in finance’s role as a business partner. A way to dig deep into the numbers and spot strategic insights about where the business can improve performance.
But if all your report shows is a basic overview of unfavorable budget variance and favorable variances between forecasts and actual results, there’s so much opportunity to squeeze out more strategic value.
If you simplify the process with financial automation and variance analysis software, you can focus less on data entry and more on investigating the numbers, which creates more strategic financial planning and budgeting processes.
Table of Contents
What Is a Budget Variance Analysis?
Budget variance analysis, often known as a budget vs. actual variance analysis, is a traditional FP&A process where you compare actual numbers from a set period (monthly, quarterly, or the fiscal year) to the ones you laid out in your plans.
This crucial budget analysis and financial reporting process is meant to provide visibility into revenue variances, actual expenses compared to budget, and other deviations from your plans and provide a basis for more strategic questioning.
Why Budget vs. Actual Variance Analysis Is Important for Healthy Businesses
Effective variance reports give you a starting point for deeper financial analysis. Identifying material variance in your business budget points you in the right direction to dig deeper into specific metrics and key performance indicators (KPIs) so you can uncover actionable and valuable insights for both business owners and department leaders.
But BvA exercises often stop short at basic financial reporting. There’s some value in variance analysis as a reporting exercise. You get a consistent scorecard that compares budgeted amounts from your plan to actual amounts for a given period, whether that’s monthly, quarterly, annually, or something in between. At the very least, it gives you insight into how accurate your cash flow forecasts are.
However, that scorecard should be a baseline—not the final result of your variance report.
Aaron Spool, Managing Director of Eventus Advisory Group, explains why simply showing variance isn’t enough by saying:
First and foremost, you have to own the outcome, then own the spend. The budget is nice, but take product as an example. You might be under budget, but if you have a 1-year delay in your product launch, it’s no wonder you’re under budget . . . I’d rather someone overspend, but they hit their targets. We get so focused on being accountable to the spreadsheet and numbers that it hinders the success of the company.
The real value of a BvA report is being able to get granular with the data and work with various teams to determine why the numbers are off when meaningful variance occurs. That’s the kind of budget variance analysis that’s absolutely crucial to healthy businesses.
Where Variance Analysis Often Falls Short on Value
There are a few key challenges that stand in the way of turning BvA from a backward-looking, basic reporting exercise into a true strategic tool for understanding the effectiveness of business plans.
These challenges include:
- Stale Data: The first step to running a budget vs. actuals report is to make sure your books are closed. If that process takes 4-10 days and finance takes another few to make sure the data aligns with forecasts, the starting point for your variance analysis is already somewhat stale. By the time you dig into the “why” behind variances, your business is already well into the next month, and insights may no longer be relevant.
- Basic Insights: Data consolidation challenges make it difficult to look at BvA at the account or even department level. Instead, you’re left with basic, high-level financial dashboards that simply confirm negative variance or positive budget variance across your income statement, balance sheet, and cash flow statement.
- Inflexible Spreadsheets: Financial model templates (and spreadsheet-based templates in general, like Excel) leave little room for a proactive investigation into budget variance. You may be able to cover a wide range of the basics with a template and add new data every month or quarter. But when you need to go deeper to find out why a variance occurred or add new line items to the template, you end up digging through different tools instead of focusing on collaborating with department leads.
The faster you can work through these challenges and get a clear picture of budget variance, the sooner you’ll be able to get to the good stuff—the deep conversations about why the forecast was off and how that impacted tangible financial outcomes.
Spot & Investigate Variances in Real-Time with Strategic Finance Software

3 Benefits of Automated Budget vs. Actuals Analysis
Automating the budget vs. actuals reporting process ensures you can get a basic overview of financial outcomes compared to the plan in minutes or hours instead of days or weeks.
But aside from saving you time every month or quarter, what’s the value of streamlining variance analysis? There are three main benefits of modernizing your BvA process.
1. The Ability to Focus on Strategic Insights
Automating the data consolidation aspects of variance analysis frees you to focus on strategic insights from your variance reports. Instead of spending days on data entry only to find category-level variances, you can focus on highlighting the strategic insights behind those deltas.
There’s a significant difference between seeing that marketing went over budget on PPC ads this month and understanding why that happened. If you don’t have granular insight into the numbers, your first instinct might be to have a conversation about cutting back on spending.
But what if you could shift the conversation to focus on the resulting sales revenue from that increase instead? If the customer acquisition cost (CAC) on that extra spending looks excellent, why not double down on the strategy? Update the budget to account for the shift in strategy and support marketing in driving business results.
A streamlined BvA process is the key to understanding the “why” behind variances. And starting a few steps ahead of the traditional approach by automating consolidation helps you focus on the investigative side of variance analysis.
2. More Collaborative Financial Planning
The foundation of a collaborative relationship between finance and other departments is a common operating picture. When you can speak the same language as your stakeholders, it’s much easier to get them to buy into your numbers and strategic insights—and the variance analysis process is a perfect opportunity to build this shared language.
Your customers across the business don’t want to collaborate in complex spreadsheets and financial statements. They want to speak in terms of their own financial goals. How many new employees will they add in the coming months to hit their targets? How much work will they have to outsource to contractors based on company goals? Are there specific strategies they plan to move away from based on recent evidence?
A valuable budget vs. actuals report helps you align on these kinds of strategic questions. And that means presenting your data in a way that makes sense to your stakeholders. Instead of showing the traditional spreadsheet, visualize the data to drill down into the units that matter most to people in the business.
For example, don’t just show the sales team lead that they were over budget on travel. Dig into the variance and show where it came from, like in the image below:
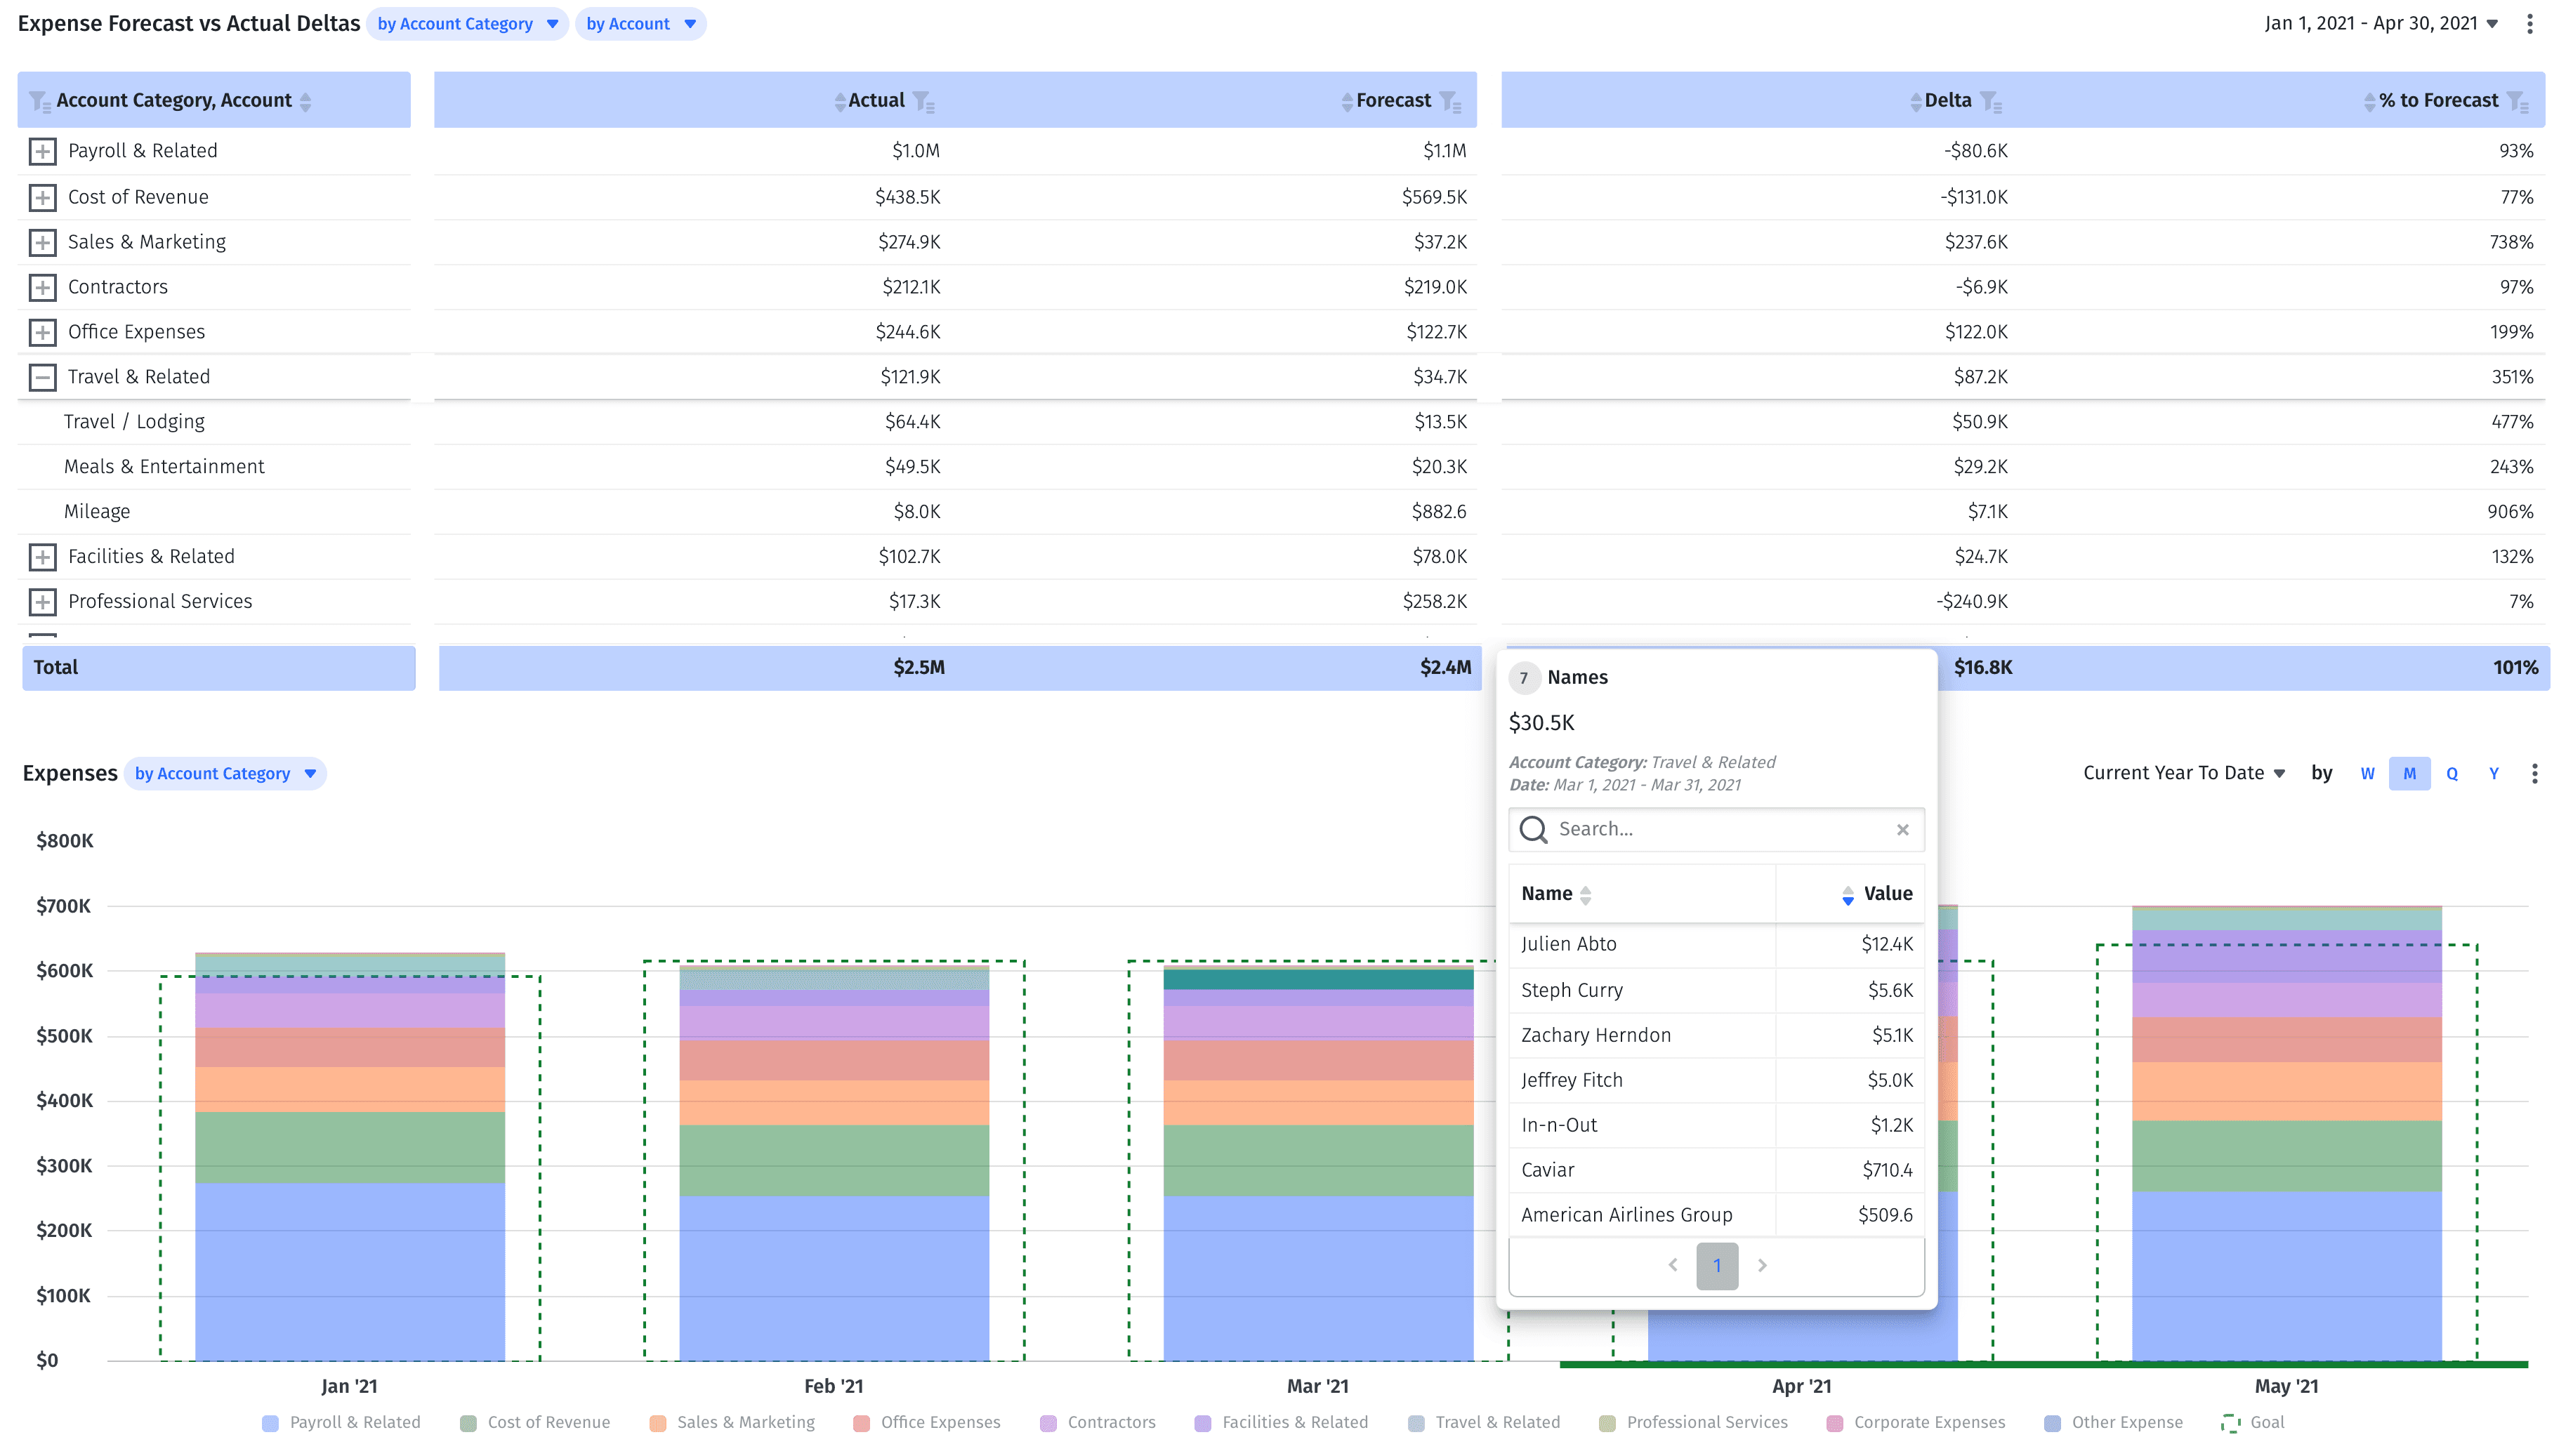
Here, you can see one sales rep outpacing the rest of the team on travel expenses. Did they add an extra event to their schedule? Was the expense worth it in terms of generating new opportunities?
When you present your numbers in these terms, it’s easier to work with people across the business, identify why variance occurs, and make informed decisions on what to do about it.
3. A Stronger Foundation for Reforecasting
Streamlining budget variance reporting helps you reforecast your plans with confidence.
Whenever you reforecast, you want to make sure you’re doing so with the latest numbers. Having access to real-time, actual costs and automated variance reporting makes it easier for your CFO and CEO to trust your numbers, elevating your role in the business.
One scenario where this benefit proves out is board meeting prep. You don’t want to go into the quarterly board meeting with plans based on data from over a month ago. Being able to reforecast your plans with the most updated information as you prepare for the meeting will help you get more value from board members and increase their confidence in you.
Automating aspects of BvA also makes it easier to reforecast according to both flexible budgets and static budgets for your board members.
Because version control is so complicated in spreadsheets (and BvA is already time-consuming), variance reports are often limited to static budgets—comparing actual revenue and costs to an approved annual budget. But automating the process makes it easier to create multiple versions of your BvA report, building flexible budgets that you reforecast on a monthly or quarterly basis without losing sight of the original plan.

How to Accurately Calculate Budget Variance with Mosaic
Mosaic simplifies the budget vs. actuals process by automatically consolidating all of your financial data in real-time. It gives you a better starting point for the BvA process so that you can investigate the root causes of budget variance more efficiently.
The Strategic Finance Platform connects to your ERP, CRM, HR system, and billing systems to centralize financial data from across your business. Automated customer, account, and department mapping ensure that your variance reports can get to the most granular level with just a few clicks.
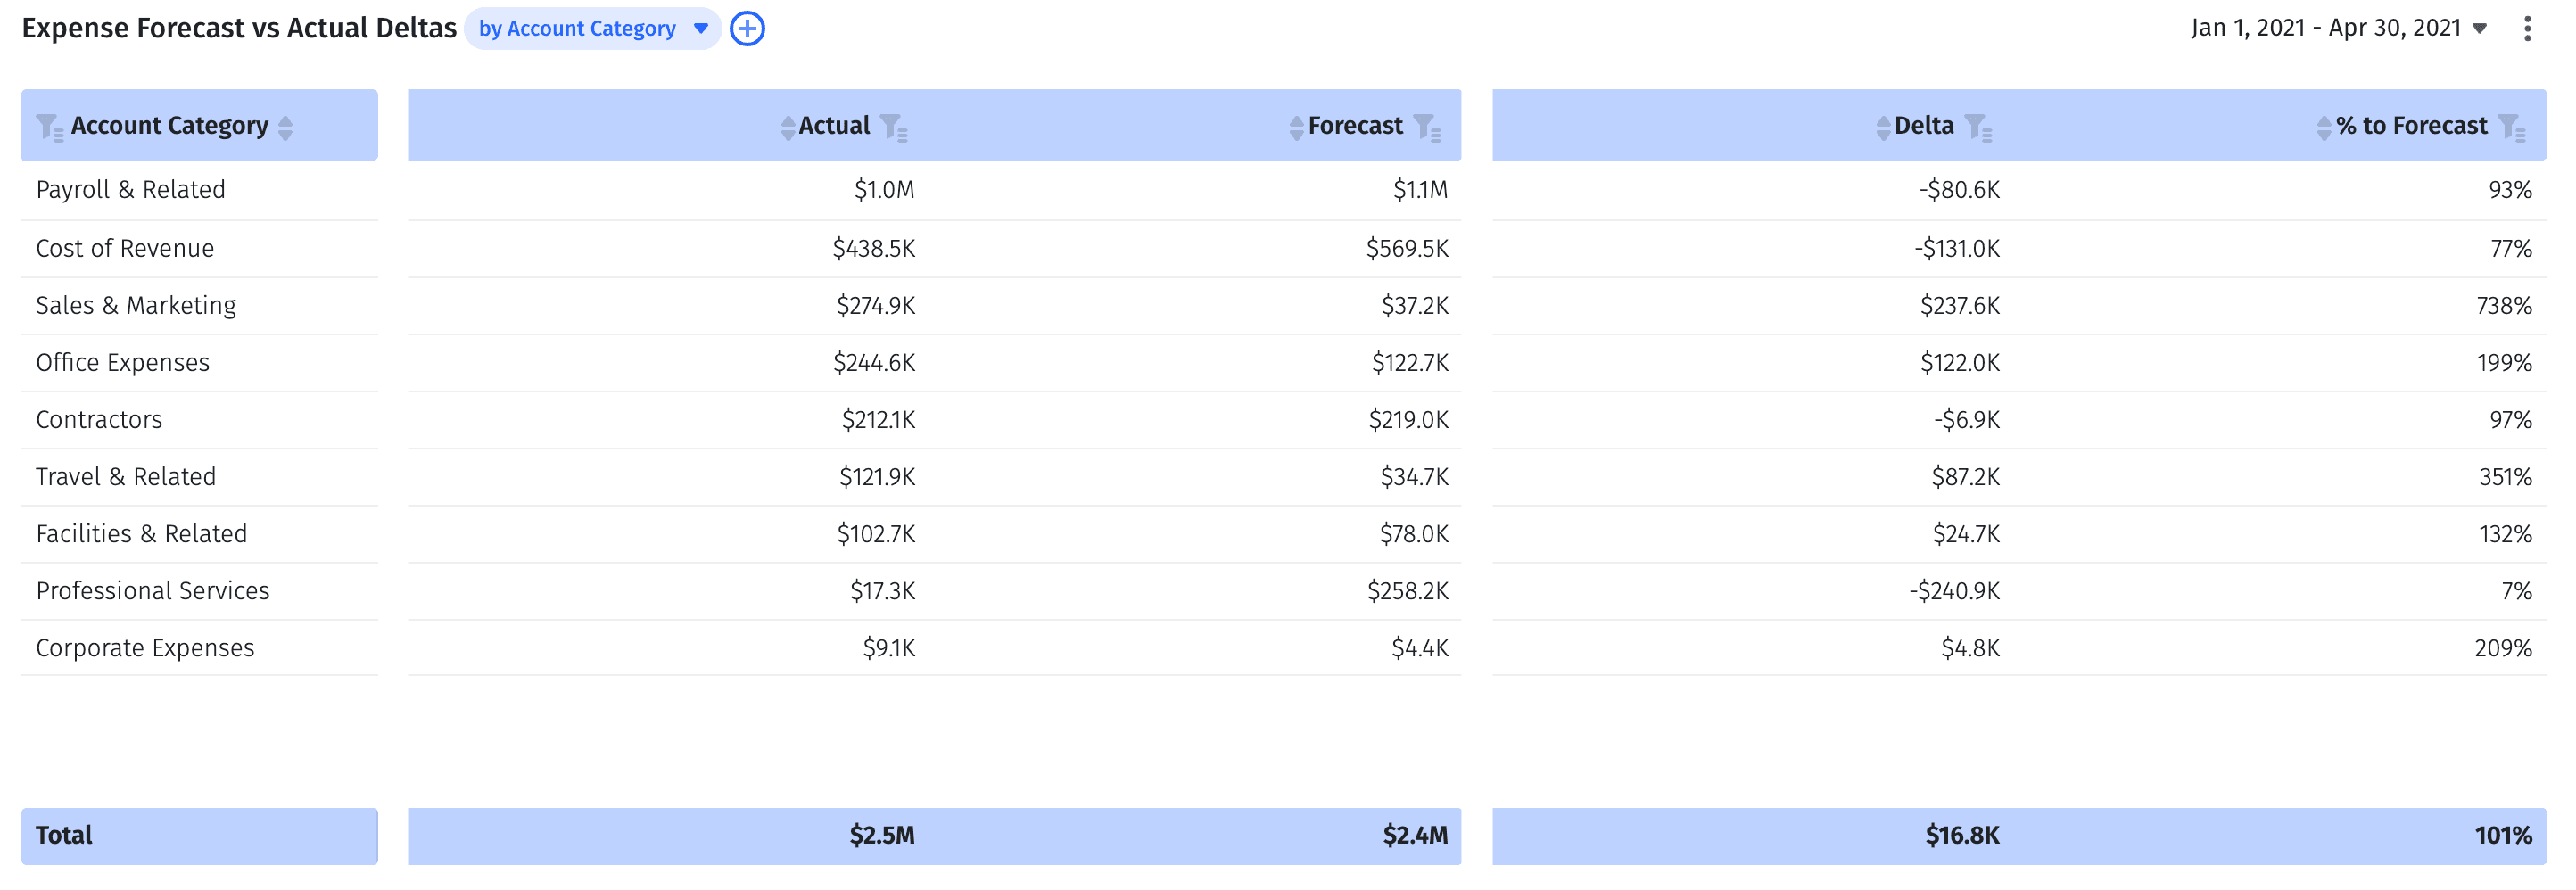
You can toggle BvA reports from the highest-level overview, like in the image below:
To the most granular level of detail, like in the following image:
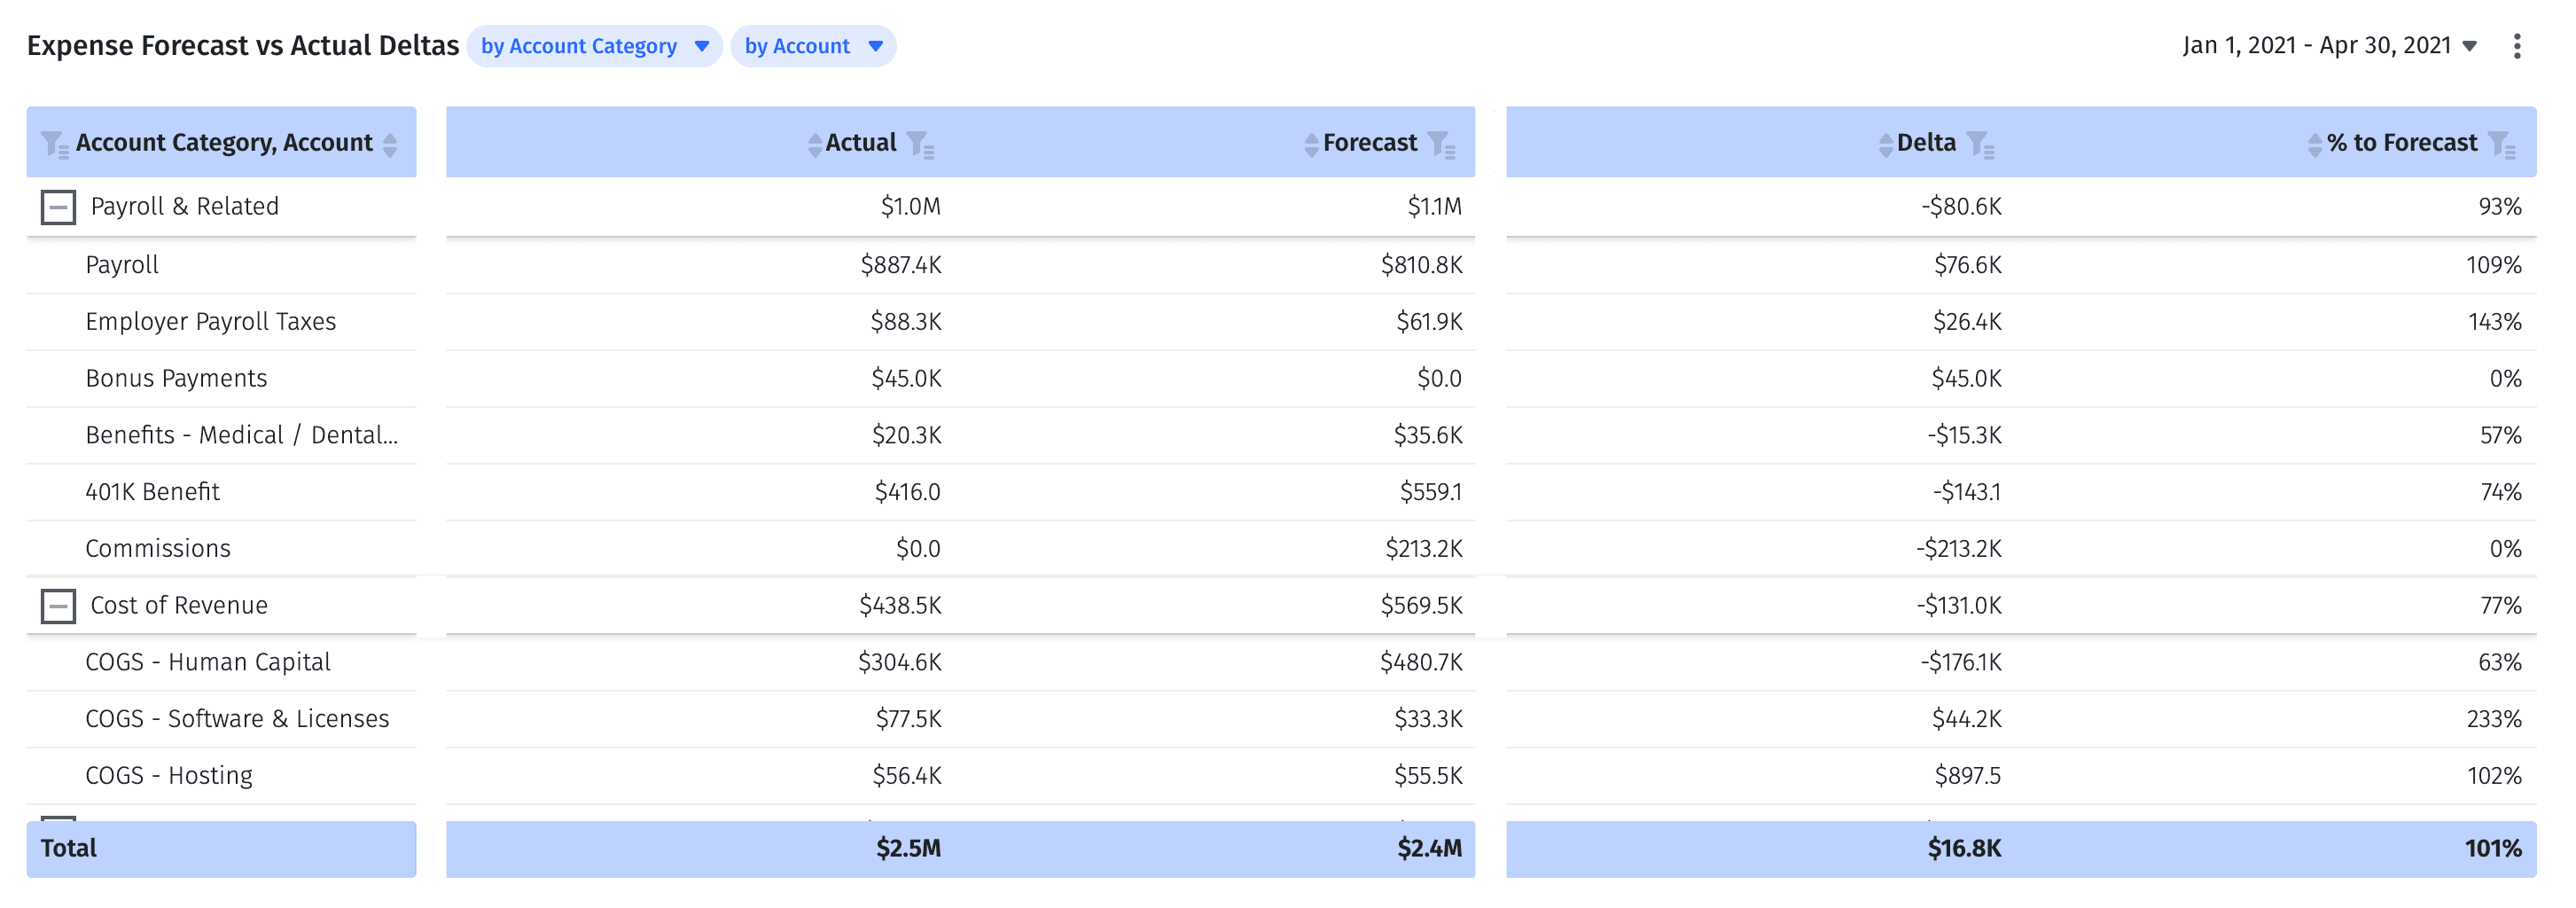
This flexibility gives you the foundation for more strategic and collaborative financial planning.
Say, for example, you’re meeting with the engineering lead to review the previous month’s expenses. You notice that the department is under budget with significant variances in both salaries and outsourced contract expenses. Instead of just reporting on the numbers, you can work with the engineering lead to dig into the variance and find the cause.
You may learn some critical reasons why the engineering team could only hire 3 new employees over the month instead of 6. That could impact your headcount planning in the future. Or, you might learn that the engineering team cut back on one contractor’s hours because of plans to increase headcount. That might help you reforecast the contract budget.
Mosaic ensures you can have these conversations with the most up-to-date information possible. Having a full BvA report ready to go a couple of days after the books close instead of 20 makes it easier to collaborate with each department and be the strategic partner your business needs.
Turn BvA into a Strategic Business Growth Driver
Strategic CFOs and their teams don’t just point out the facts in variance reports. They offer actionable insights to people across the business to help drive the company toward its mission.
But you can’t bring that strategic value if BvA becomes a process of just checking boxes weeks after the month you’re reporting on is already over. Mosaic gives you the tools to quickly identify variances and where you might want to look as you investigate their causes. That’s the foundation for a strategic business partnership and more collaborative, effective financial planning.
Want to see how easy it is to analyze budget vs. actuals in Mosaic? Request a demo to learn more.
Budget Variance Analysis FAQs
What is budget variance?
Budget variance is the divergence between the budgeted income or expense and the actual, final figure (be it revenue or cost). Types of variances can range from direct labor costs to overhead costs.
Variances fall under two categories:
- A favorable variance occurs when actuals come in better than the original measurement
- A negative variance occurs when actuals come in worse than the original measurement
What is a good budget variance?
What steps are involved in budget variance analysis?
What’s the difference between budget-to-actuals and budget variance analysis?


Own the of your business.
