The 16 Most Important Employee Turnover and Retention Metrics for SaaS Businesses
What Are Employee Turnover Metrics?
Employee turnover metrics help you track the rate at which employees leave your company, visualize the patterns in employee turnover, and foresee employee-related issues. HR teams monitor these metrics to understand the health of a company’s growth.
Categories
Table of Contents
How To Calculate Employee Turnover Rate
Employee turnover rate refers to the percentage of employees who leave the company over a period of time. You can calculate it monthly, quarterly, or annually.
To calculate the employee turnover rate, divide the number of employees who left your company during a specific time period by the average number of employees during that period, and multiply the result by 100.
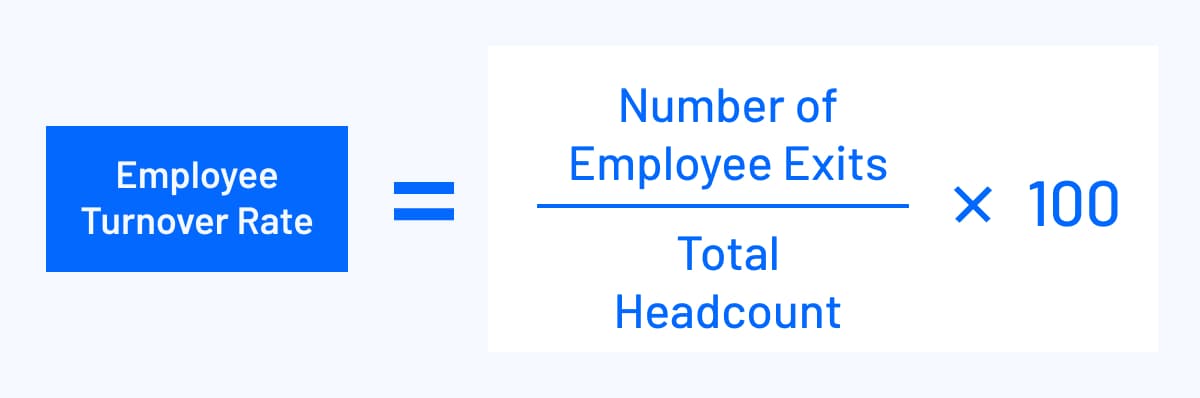
To calculate your average number of employees, follow this formula:

An Example of How To Measure Employee Turnover
Suppose your SaaS startup had 20 employees at the start of the first quarter. During the quarter, five employees left your company and 15 newcomers joined, taking the final headcount to 30.
Here’s how your finance team and HR professionals can calculate the quarterly employee turnover rate:
Average Number of Employees = (20 + 30) / 2 = 25
Quarterly Employee Turnover Rate = (5 / 25) x 100 = 20%
You can compare your employee turnover rate with similar companies to determine where your human resource management stands. SaaS Capital found that the fastest-growing SaaS companies (with annual growth rates of over 50%) had an employee turnover rate of around 7.5%. If your SaaS startup experiences high growth but still has a turnover rate of above 10%, your retention efforts are lacking, and you need to look into the issue.
What Employee Turnover Metrics Mean for Your Business
A high turnover rate decreases productivity, lowers company morale, and disrupts sales opportunities. Not to mention that you burn cash recruiting and potentially allocate more budget to contractors to cover the gaps. Additionally, understanding revenue per employee can provide further insights into how turnover affects the company’s financial efficiency, as this metric reflects the revenue generated by each employee, highlighting the impact of workforce changes on overall revenue generation.
Employee turnover metrics help you provide key insights to HR leads who can then reassess and change procedures to make it less likely for talent to leave.
How to Unlock a Smarter People Strategy

The 16 Most Important Employee Turnover and Retention Metrics
With employee turnover metrics, finance and HR departments can better understand the company’s growth, talent turnover, and hiring process.
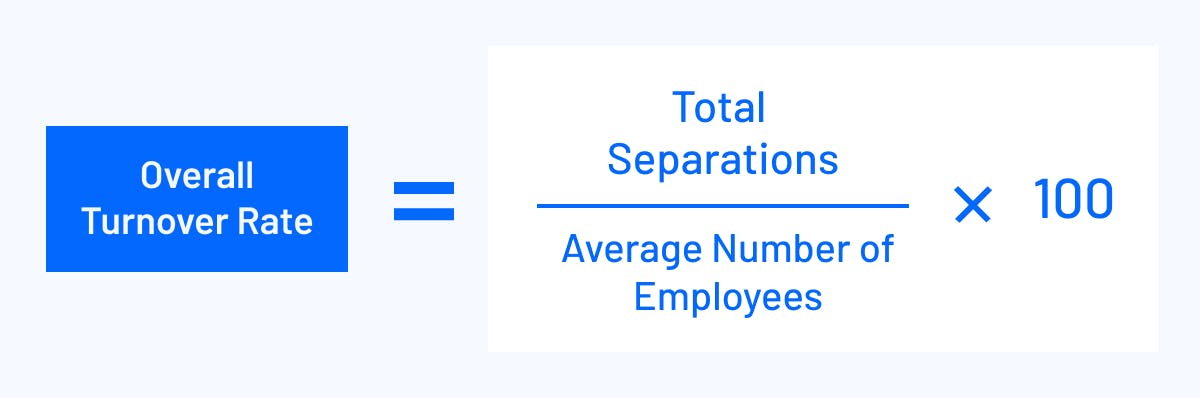
1. Overall Turnover Rate
Your overall turnover rate is a high-level measurement of your employee turnover. This employee turnover metric tells you how many employees leave your company. You can do this monthly, quarterly, or yearly.
To calculate your turnover rate, take the total number of employees who left the company, divide it by the average number of employees over a specific time period, and multiply by 100.
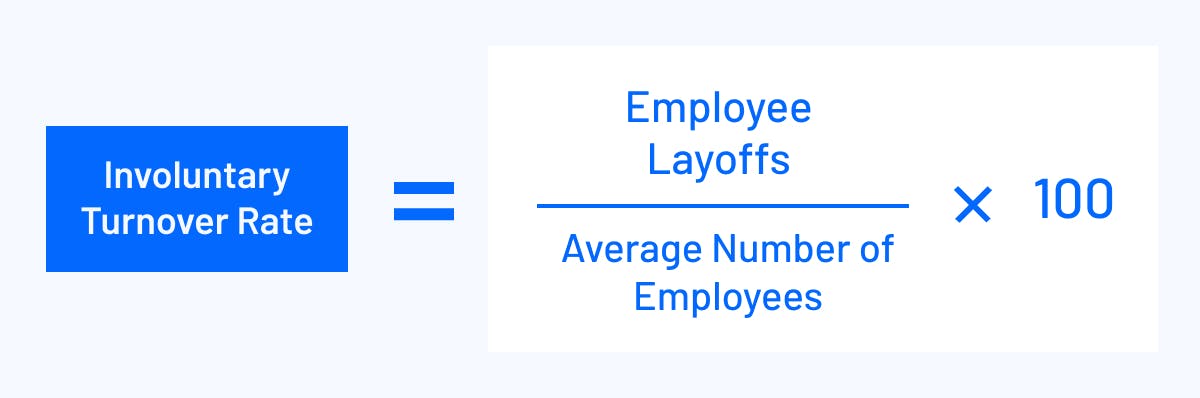
2. Involuntary Turnover Rate
Your involuntary turnover rate observes the rate at which an employee leaves the company involuntarily, whether through a termination or layoff. To calculate involuntary turnover, take the number of talent layoffs in a given time period, divide it by the company’s average headcount, and multiply the result by 100.
On average, companies trend around a 6% involuntary turnover rate. If your company hovers around the average involuntary turnover rate, it most likely means the company only lets go of low performers. In contrast, a high involuntary turnover rate suggests your hiring managers are hiring people who don’t align with the skill set or company culture, or that the business could not sustain their employment due to lack of revenue.
3. Voluntary Turnover Rate
The voluntary turnover rate measures the rate an employee leaves the company voluntarily. To measure your voluntary turnover, take the number of employees who quit in a given time period, divide it by the average headcount, and multiply the result by 100.
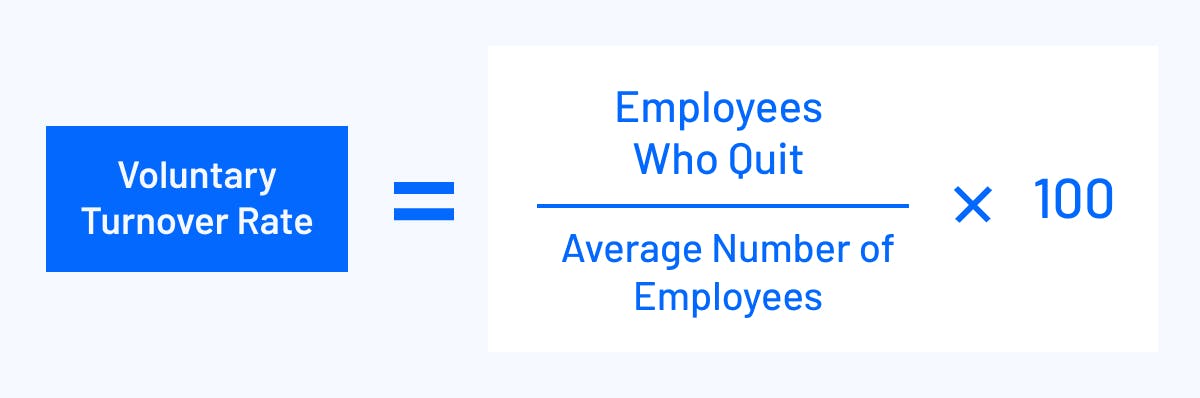
Mid-size SaaS companies experience around an 11% voluntary turnover rate. As your voluntary turnover reflects employee morale or dissatisfaction with company culture, HR and department leaders will want to ensure that they have the tools they need to keep employee engagement high for a low turnover rate.
4. Turnover Cost
Turnover cost refers to what it costs to replace an employee. You determine turnover cost by adding your direct and indirect turnover costs, which include advertisement fees, recruitment expenses, unemployment benefits for involuntary leaves, onboarding costs, and productivity losses for a specific department.
Your budgeting process may already anticipate headcount planning, but you will need to collaborate with HR and leadership throughout the year to ensure headcount stays on track or anticipate any involuntary turnover. You can then build a more agile forecast that accounts for turnover cost.
Knowing your turnover cost allows department leaders to be more proactive in how to keep it as low as possible. HR could establish a strict timeline for the hiring process, and collaborate with respective department leaders to ensure availability to participate and make agile decisions on who to hire. And while hiring quickly helps inhibit any productivity loss, onboarding and the ramp to full productivity will take time.
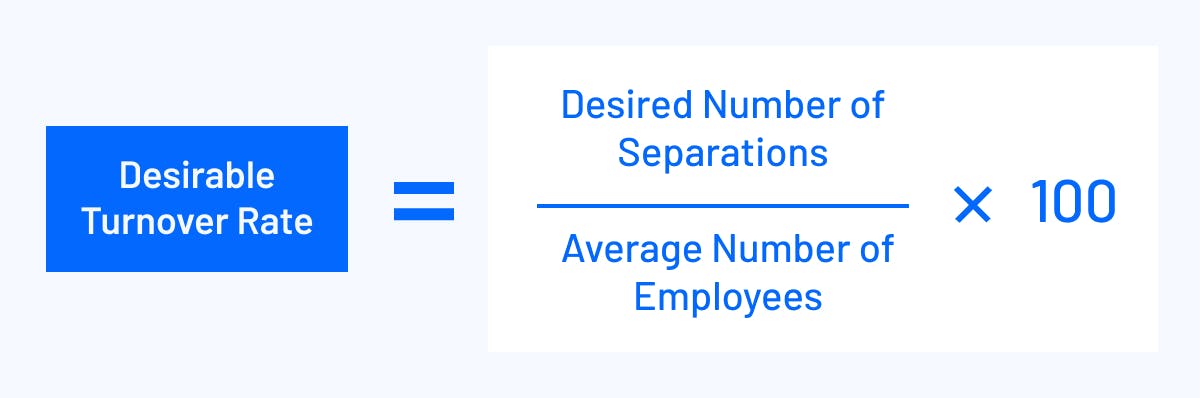
5. Desirable Turnover Rate
A desirable turnover rate considers employee turnover that is favorable for the company, like terminating or losing an underperforming employee, then hiring someone to replace them. This metric puts your hiring practices and evaluations into perspective. HR can work with recruiters and department leaders to improve their sense of culture fit and leveling within the company.
To calculate your desirable turnover rate, define the number of employees that will be laid off, and divide it by the average number of employees. Then, multiply the result by 100.
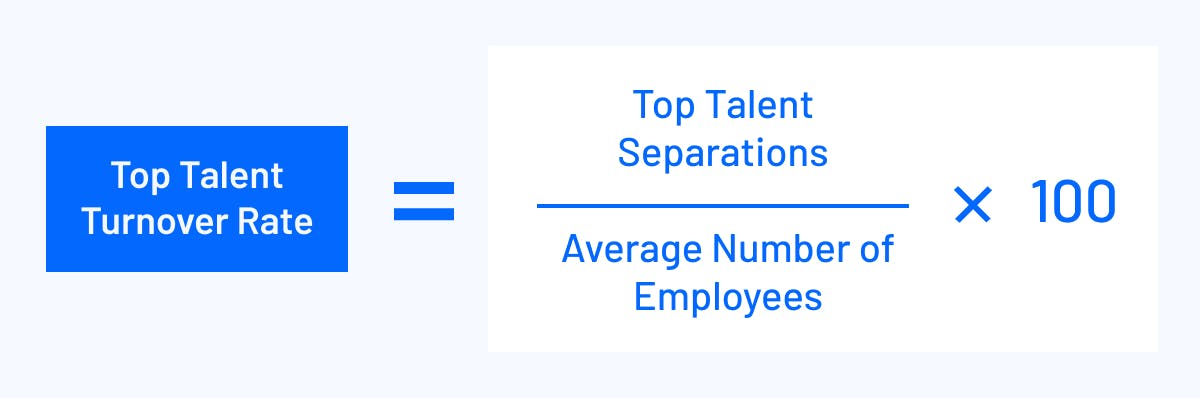
6. Top Talent Turnover Rate
Top talent turnover, or undesirable turnover rate, examines the amount of high performers leaving the company. This granular turnover metric is important for HR to track as it may indicate a wave of dissatisfaction among high-performing team members in a specific department or across the company. HR can then dig deeper into specific cases with department and executive leaders to determine a strategy for employee retention and people-culture fit with any new hires.
To begin calculating this metric, HR and department leaders should indicate who, out of the resigned employees, were their top talent. You will then add the number of top performers who leave the company together, divide that number by average headcount, and multiply the result by 100.
7. Turnover Rate by Department/Manager/Position
This metric gets even further into granularity by examining the turnover rate per position or department. You can calculate the turnover rate based on the number of employees for a specific department or position.
This amount of granularity allows you to monitor any trends in turnover. For example, if five employees turn in notice, and three are from the marketing department, you can point that out to HR. With the marketing lead, HR can then investigate what improvements need to be made in regards to workload or growth opportunities.
8. Overall Retention Rate
Your overall employee retention rate looks at overall employee retention across the company, regardless of department. To measure your overall retention rate, subtract your overall turnover rate from 100.
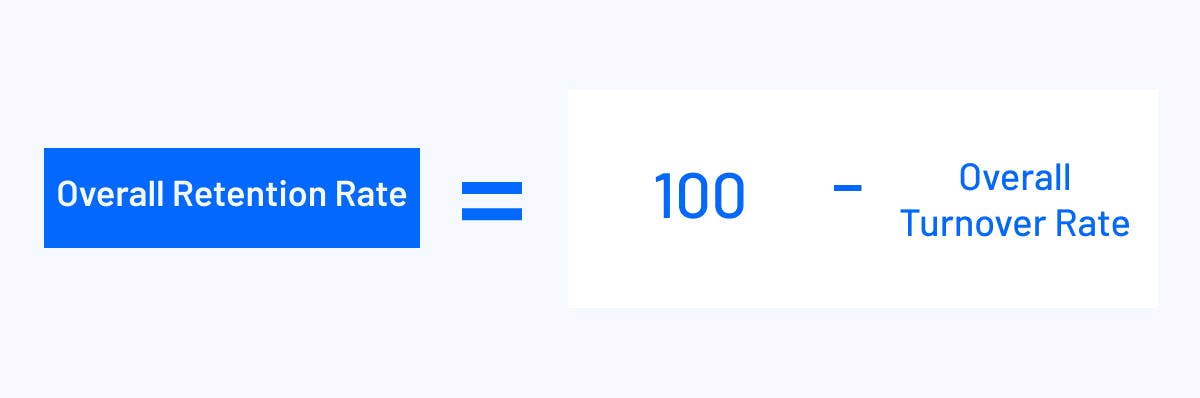
This employee retention metric lets you gauge your company’s work-life balance, employee satisfaction, and work environment at a high level. Retention also correlates with higher engagement and productivity across the board.
9. Retention Rate by Department/Position
Retention rate by department or position is another next-level granularity stage of your overall retention rate. If you want to categorize your retention rate by department or position, determine the turnover rate from the specific department or position, then subtract it from 100.
This retention rate allows you to optimize your budget according to department or position. As employees stay with the company, they anticipate salary increases over time, which you can keep an eye on with this metric. The HR department can then take this metric further by evaluating team performance reviews and collaborating with department heads and leadership to determine the percentage raise that can be allotted per employee when the time comes.
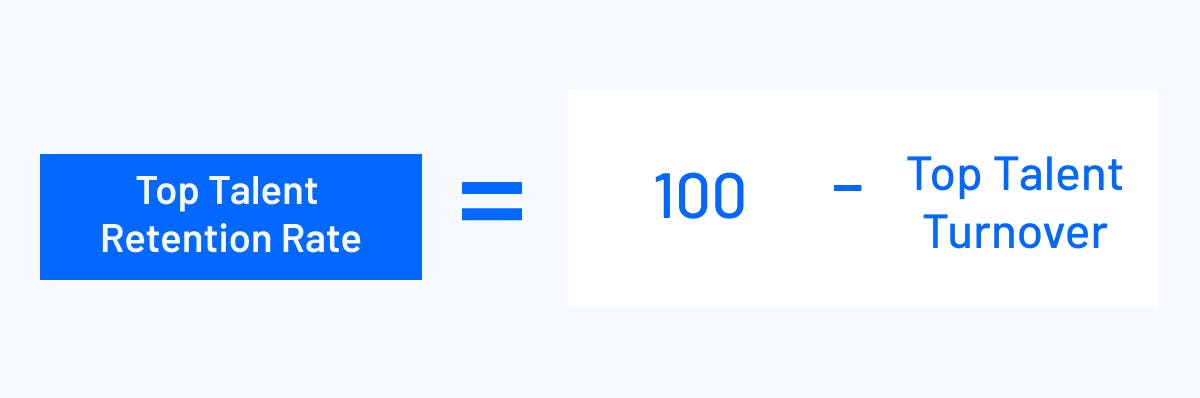
10. Top Talent Retention Rate
Just like your top talent turnover rate, you want to keep an eye on your top talent retention rate. Top talent retention rate is a great indicator of organizational growth across the company, as well as overall productivity and morale.
You can measure top talent retention across the company or by department. Simply subtract the top talent turnover number from 100.
11. New Hire Retention Rate
As new hires need to spend time onboarding and ramping up to full productivity, it’s important to acknowledge the number of new hires that stay with the company compared to the total hires during that specific time period.
To measure your new hire retention rate, divide the number of new hires who stay with the company for a given period of time by the number of employees hired during the time period. Then, multiply the result by 100.
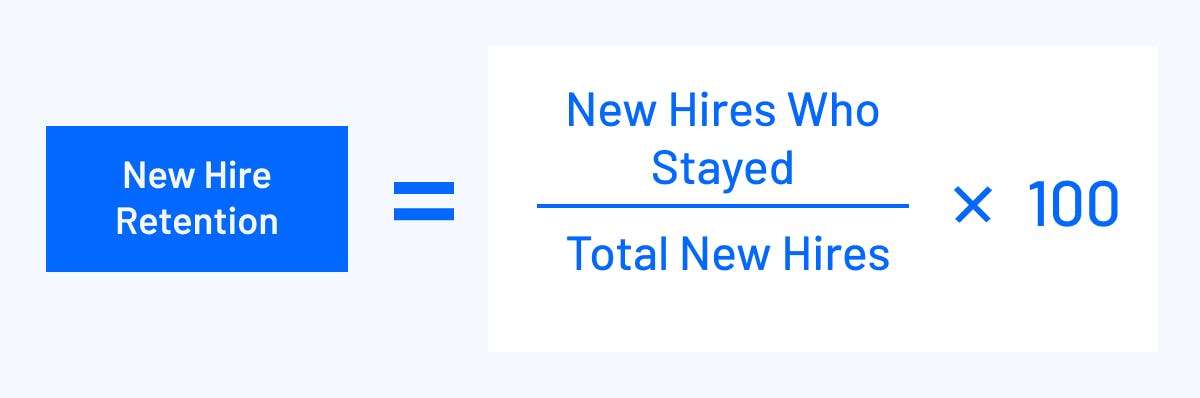
With your insights, you can then collaborate with HR and department leaders so that they can improve their onboarding processes. You’ll also gain clarity that you can apply to your spend forecasting efforts for future hiring cycles.
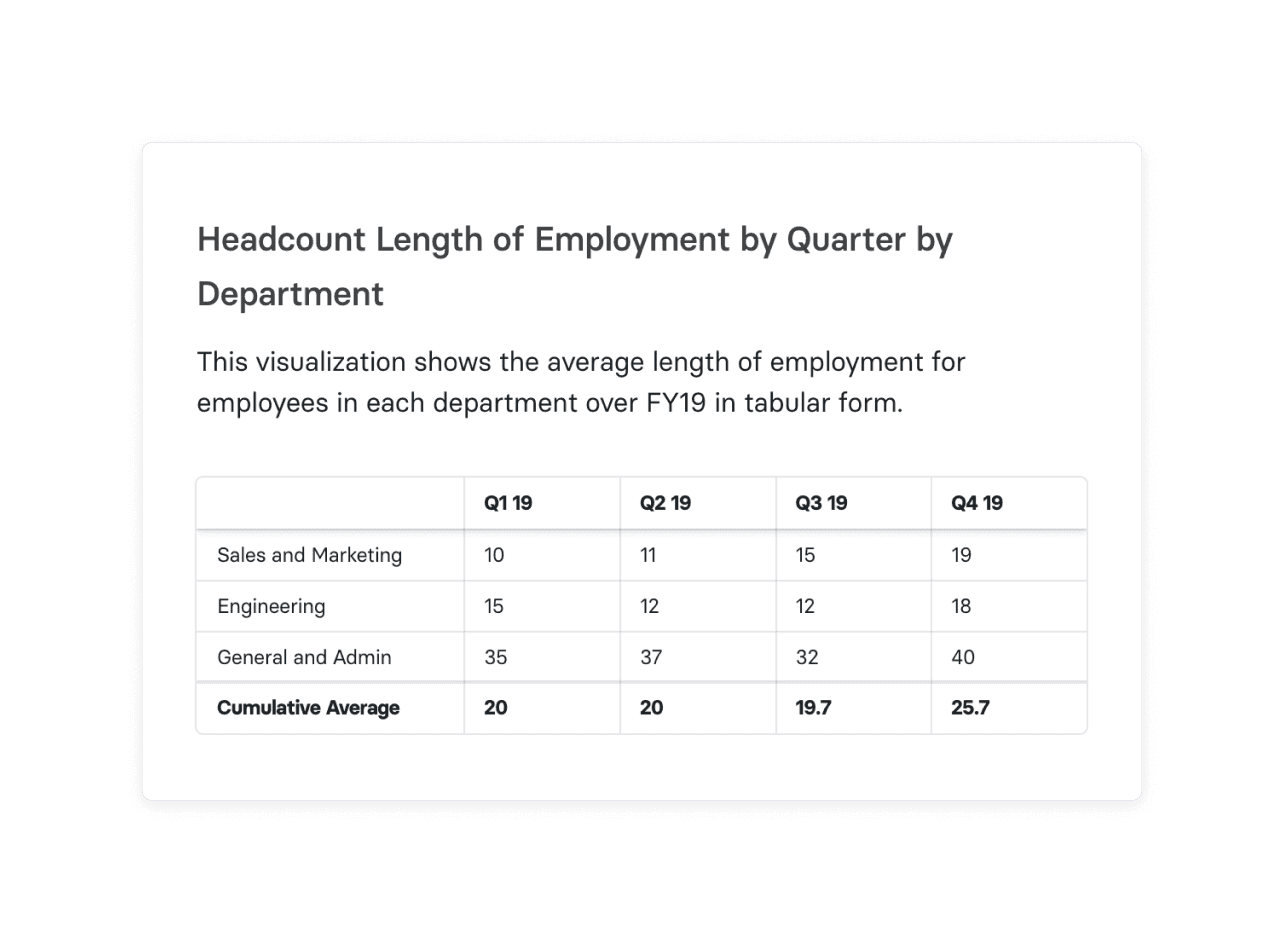
12. Average Length of Employment/Tenure
An average length of employment points toward the general length of employment across the company. Take the total number of years each employee has been with the company, and divide the result by the total number of employees.
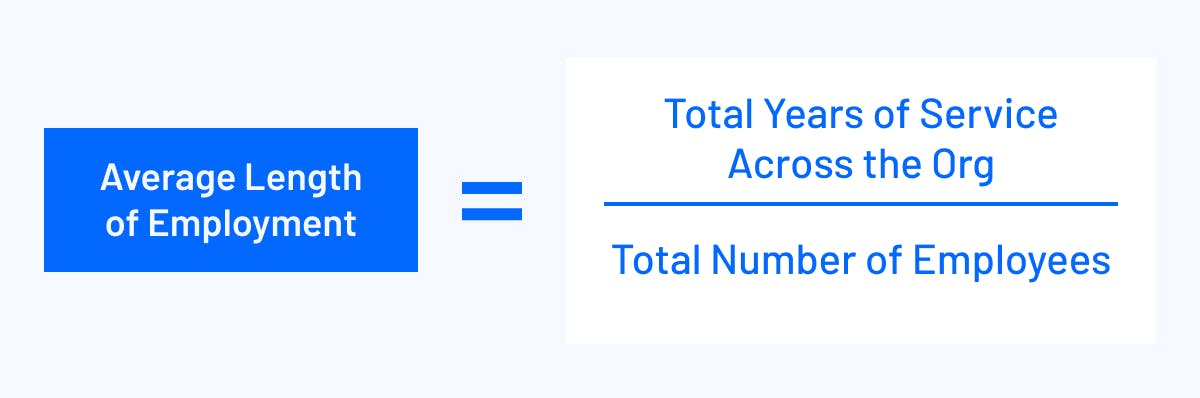
This metric shows you the average employee tenure you can expect. You can dig deeper into the data by focusing per department or position, if the company is large enough to gain a strong sample. Digging deeper into your average tenure allows you to build stronger workforce planning examples, which provides strategic insight for your HR leaders to consider when workforce planning.
13. Employee Satisfaction Rate
Employee satisfaction feeds into employee engagement and culture. Highly-engaged employees tend to be more productive, which means faster results across the organization in terms of goals and initiatives.
To measure overall employee satisfaction, divide the number of satisfied employees by the total number of employers, then multiply the result by 100. The higher the number, the higher your employee satisfaction rate.
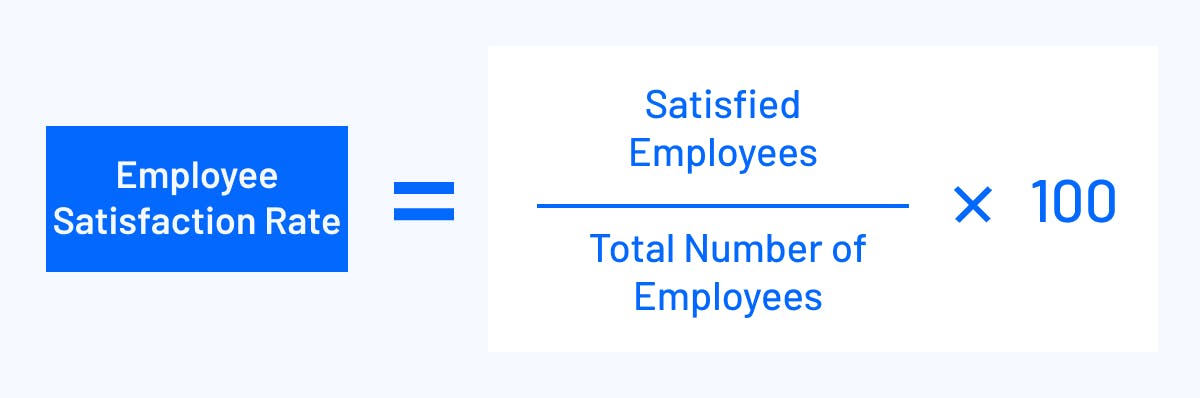
HR can conduct anonymous employee surveys to get the most accurate measurement of overall employee satisfaction. Keep in mind that these surveys may not receive 100% participation, so the number may remain a sample. Regardless, it remains a good metric for HR to track to anticipate any improvements and collaborate with department leaders on what improvements can be made, such as higher salary leveling or more growth opportunities.
14. New Employee Satisfaction Rate
Your new employee satisfaction rate measures the level of satisfaction new hires feel while working with the company. Most likely, HR would request this information specifically after the onboarding period (typically around 90 days).
The first step to measuring new employee satisfaction is for HR to provide a survey to new employees. Once answers are in and HR determines the number of satisfied new hires, you can then divide that number by the total new hires for that period, and multiply by 100.
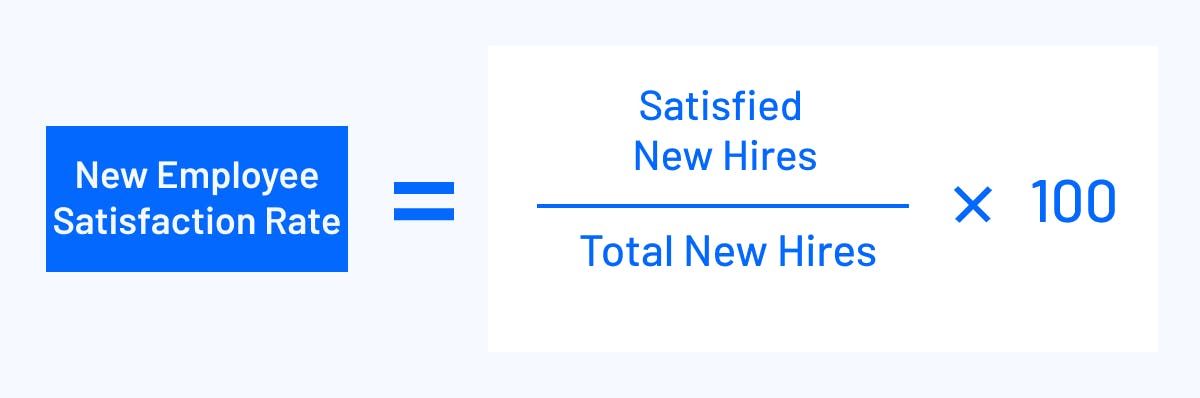
If the number is low, HR can then investigate how to improve the onboarding process for new employees.
15. Overall Salary Adjustment
This employee turnover metric lets you compare how the salary adjustments impact turnover. Once you determine the total salary adjustments across a specific team, divide that number by the total original salary for that team. Then, multiply that number by 100.
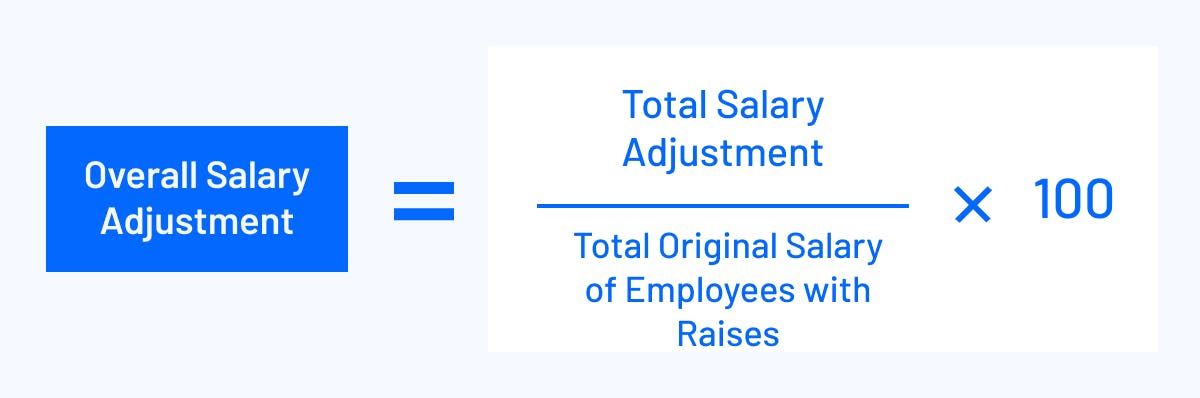
This metric can also be a high-level scope with overall adjustments across the company to trend internal growth. These numbers can then factor into overall headcount planning for future forecasts.
16. Empty Positions
HR and department leaders understand the scope of work their teams engage with everyday. To that end, departments can see where there are gaps within their departments, and make a hiring request. Once the job ad goes up, HR then keeps a tally of positions they need to hire for — which are known as empty positions.
Knowing how many empty positions exist across the company allows you to calculate the costs that incur while the hiring process takes place. Costs include the hours HR and department leaders work through reviewing application materials and interviewing candidates, as well as any costs associated with the ad placement on an employment platform.

Track Employee Retention and Turnover Metrics and KPIs with Mosaic
Calculating these turnover metrics via spreadsheets can quickly become a frustrating process. But that doesn’t mean you should overlook these critical metrics to save time and resources.
A 2022 Prophix survey shared that 35% of CFOs have moved their technology to the cloud to speed up their planning and forecasting. To stay competitive, you need to do the same.
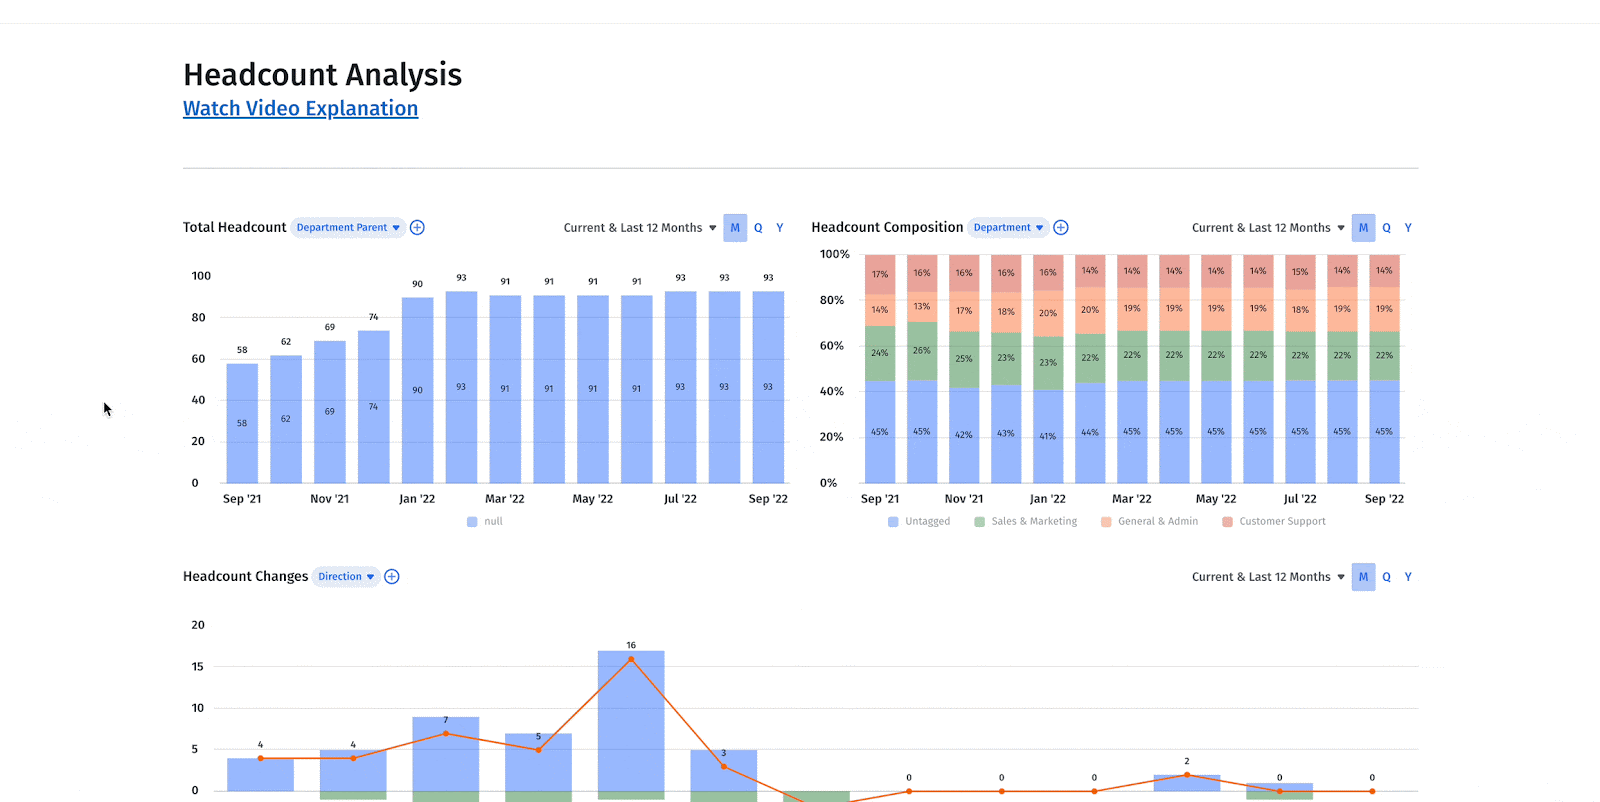
Mosaic offers headcount planning and advanced forecasting templates to help you stay ahead of the curve. Companies can access real-time HR, finance, and business data in the same location to plan and model various workforce strategies and scenarios. Once you integrate your source systems with Mosaic, you can track the most important employee turnover metrics via Mosaic’s headcount dashboard.
Get more agile, strategic insights with Mosaic’s out-of-the-box employee turnover and retention metrics — request a personalized demo today.
Employee Turnover Metrics FAQs
What is a good employee turnover rate?
The ideal employee turnover rate for a healthy company is less than 10%.
What is the difference between employee turnover and attrition?
How do you evaluate employee retention?
Explore Related Metrics


Own the of your business.
