

For SaaS companies, retention is the second most important metric right behind ARR. More and more, it’s what dictates SaaS valuation as investors look for companies that can use their existing customer base to fuel growth.
But truly understanding your retention metrics is more complicated than it seems. It’s one thing for finance to calculate these metrics. But strategic finance isn’t just reporting retention numbers in your board deck.
The real value of customer retention analysis is when you dig into the numbers, proactively identify issues in the business, and help guide solutions. Here’s how to do it.
Table of Contents
What Is Customer Retention Analysis?
Customer retention analysis is the process of tracking and digging into the “why” behind financial metrics that highlight customer churn in different ways.
Traditionally, retention analysis is a process consisting of building out spreadsheets that collect all deal-related data, including contract values, start/end dates, assigned account executives, product line, service level, etc.
Constantly updating your spreadsheets with new deals and spending time on data visualization can be painful. But it’s critical to understand how good you are at retaining customers — and how you can use your customer base to fuel growth.
Why Is Customer Retention Analysis Important?
Customer retention analysis is important because it provides deep insight into the health of an organization. This includes understanding the cost of customer retention, which is a key factor in evaluating the effectiveness of retention strategies.
Finance calculates retention metrics to provide updates on a company’s financial health. But it’s not just about looking at user retention from a financial perspective. Good retention could indicate strong alignment between sales and marketing. It could mean your investments in customer satisfaction are returning real value. And it could provide validation for your product roadmap.
Getting the overview of key retention metrics is just the starting point. Customer retention analysis delivers true value when you start cutting the data and looking at metrics in a deeper way.
What benefits does that offer?
It Helps Finance Teams Answer Some of the Toughest Questions about the Business
Analysis begins with questioning, “Why is this number the way it is?” Asking “what” and “how” dives deeper into crafting an actual customer retention model that can be shared with departments to continue crafting the full report.
Use the following questions to guide your analysis:
- What does our net dollar and gross dollar retention look like by product line? By industry? By customer success manager?
- How should we prioritize features on our product roadmap to maximize value to customers?
- What changes do we need to make to pricing and customer service to improve retention?
Segmentation refines the general metric into specific insights you can share with departments, who can then continue investigating and making actionable recommendations and decisions toward stronger retention measures. When finance can effectively pull all the necessary KPIs together to measure customer retention, they can uncover opportunities to proactively reduce churn rate or invest in product lines that are working.
It Unlocks a More Efficient Means of Revenue Growth
A general rule of thumb is that user acquisition costs five times more than retaining existing customers. While your sales and marketing strategies push to increase top-line revenue by driving new users to your products and services, effective customer retention strategies can do that while also improving your bottom line.
The benchmark for net revenue retention (NRR) for SaaS companies is 120%. In an ideal world, companies retain all their customers (which hits 100% retention) and upsell each customer year over year — hence the high percentage.
If you want to hit that 120% NRR benchmark, you need effective retention analysis that tells you where things are working and where they aren’t.
It Improves Valuation for Your Next Funding Round
Retention is just as important to investors as revenue growth.
SaaS valuation is increasingly being driven by NRR as opposed to revenue growth alone. A study conducted by the Software Equity Group concluded that when ARR growth rates are equal among companies, those with 100% or higher NRR earned a higher evaluation. This is because these companies proved they could earn more from their existing customer base, which helps make up customer acquisition costs.
Investors see that customers want to stay and pay more to do so, which drives recommendations to improve marketing efforts that bring more new customers in the door.
Plan for growth with our Financial Planning Blueprint.

Important Customer Retention Metrics
There are so many different customer retention metrics that are important depending on your business model, products, and services.
But for SaaS companies, these are the three most common that prove their importance again and again.
Logo/Customer Retention Rate
Customer retention (often referred to as logo retention) compares the number of customers you retain versus the customers that churn over a specific time frame. It’s the inverse of your churn rate.
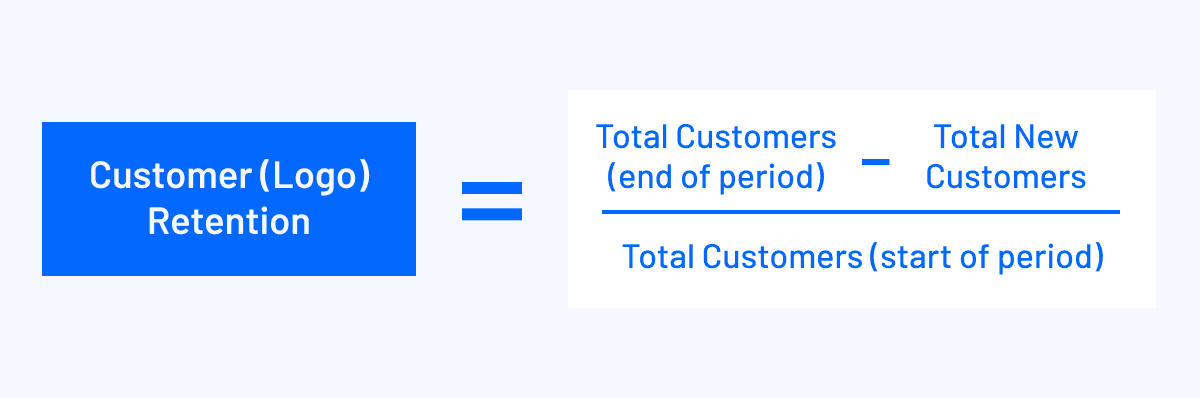
This metric, whether conducted per month, quarter, or annually, helps determine trends that can help improve product/market fit, alongside how your product aligns with your target audience.
Getting pricing and product-market fit right is crucial. If you’re losing logos and are confident in the current state of your product, it might be because you’re selling to the wrong accounts. Finance can look for patterns in the types of accounts that are churning and the product lines they’ve purchased.
Net Revenue Retention
Net revenue retention, or net dollar retention, is calculated by looking at how recurring revenue (MRR or ARR depending on your business) grows or contracts over a period of time.
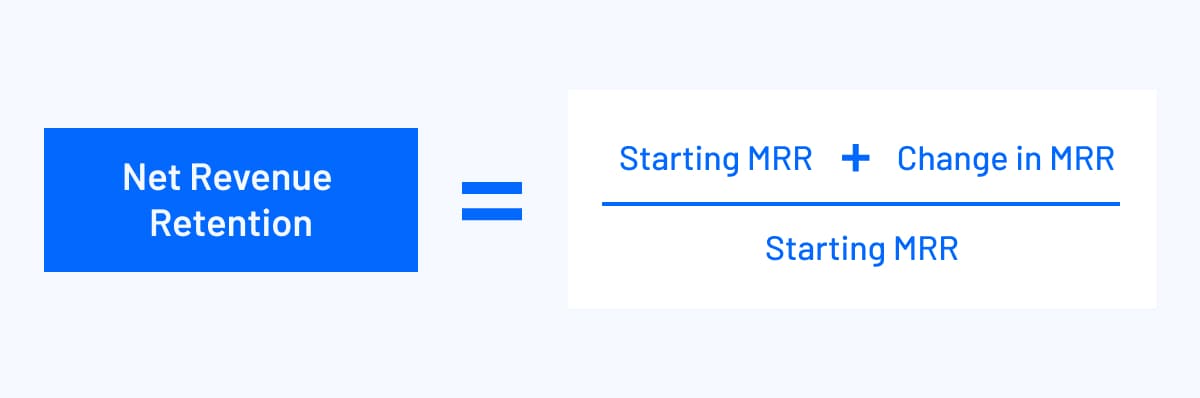
The metric determines how customer lifetime value has changed during the calculated time period. Again, the value can be over 100% due to upsells and contract expansions from current customers.
NRR can also tell companies about their SaaS pricing strategy, which may have to change to scale alongside customers. Fivetran, for example, realized their pricing didn’t align with the marketplace or the value they offer to customers. Would your business benefit from changing from a subscription to usage-based model (like Fivetran) so your revenue scales alongside a customer’s needs?
Gross Revenue Retention
Gross revenue retention (GRR), or gross dollar retention (GDR), looks at lost revenue for a given time period from downgrades and churns.
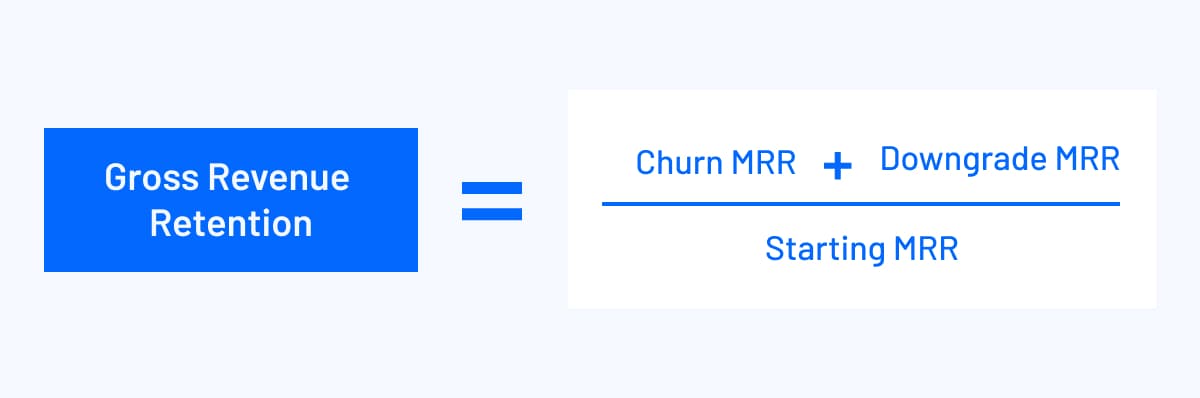
GRR doesn’t take into account any sales, upgrades, or expansions, which is why it can’t go above 100%. GRR is calculated through downgrade and churn MRR. The metric leads toward understanding where customer experience fails and where it can improve.
The initial response is to invest more in customer success/service. If you find that your GRR is low, it may be because you aren’t supporting accounts the way they need. Look at service levels for churning customers, and consider whether you need to add more resources to your customer success team to improve customer engagement.
Track Your Most Important Retention Metrics in Real-Time with Mosaic

Step-by-Step Retention Analysis Example in Mosaic
There are many ways to look at retention, but net revenue retention is the metric your investors are hungriest to see (and understand).
Hitting the 120% benchmark is the gold standard — your company is making money off of its existing customer base. If NRR remains at or above 100%, your retention efforts are solid. But if it falls below 100%, it’s time to dig deeper into where the user journey and user experience are falling off.
Don’t just go to your board or executives to report the NRR number for the month or quarter. Follow these steps to take retention analysis a step further.
Step 1: Set the Stage for Retention Analysis
We’re at our starting point. We need to pull up ARR by customer. From there, we can filter the chart to calculate and review NRR. For this exercise, we’ll look over NRR data for 2021.
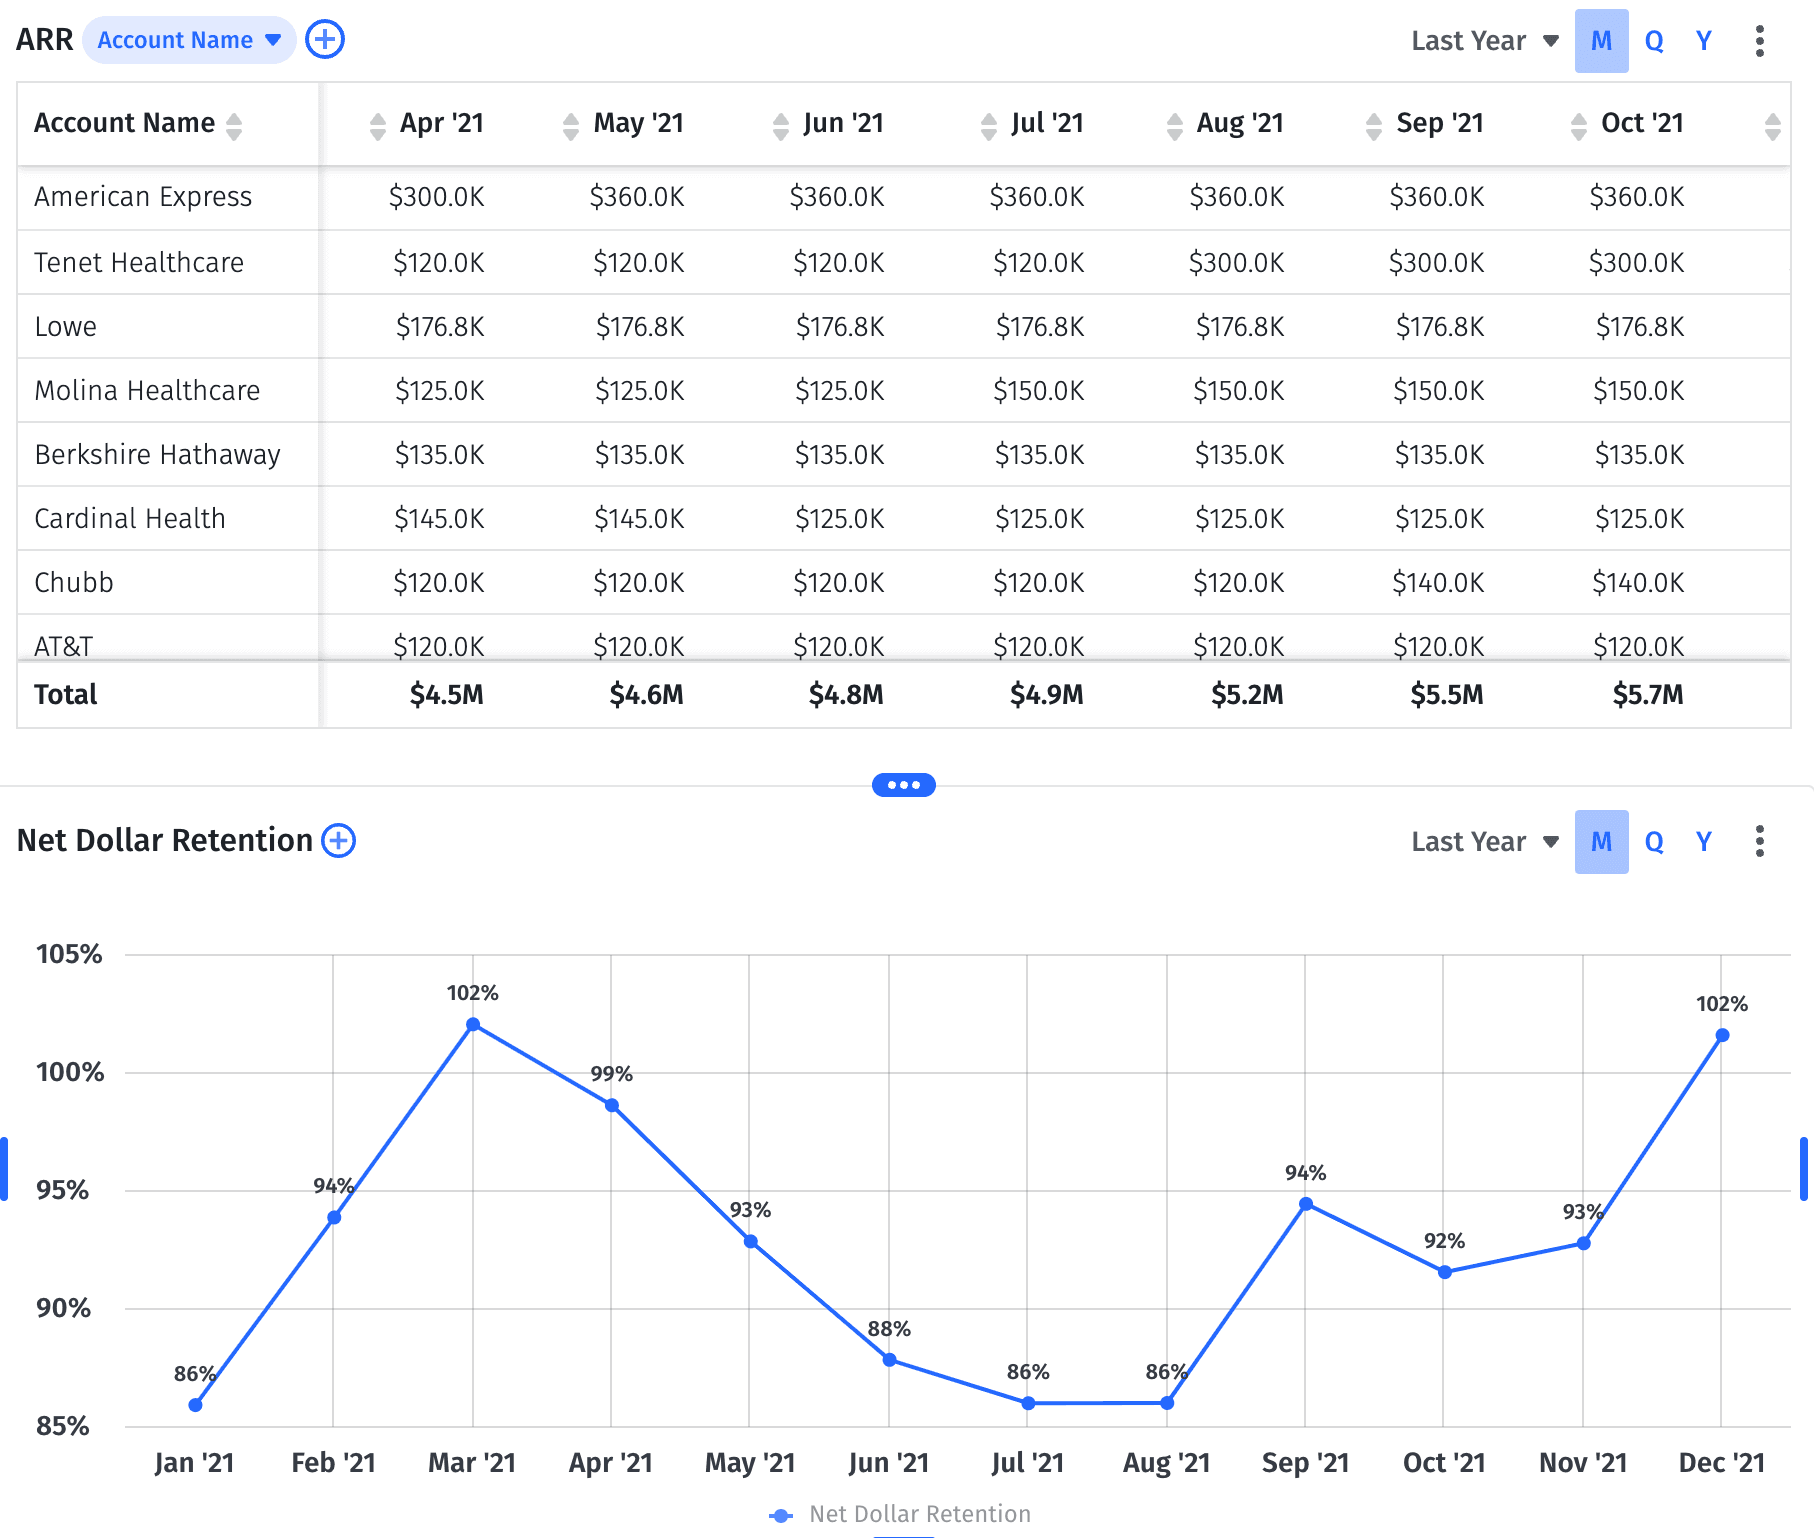
Keeping the 120% benchmark in mind, you want to dive into anywhere below 100%. Now is the time for finance to dive deeper: Finance needs to explain why NDR is so low, and the only thing worse than being off a benchmark is not knowing why you’re off.
Step 2: Cut Your Retention Data on a Deeper Level
There are different options for cutting NRR data. Product line, customer success management, and service tier, among others, are important to keep in mind as you explore why the numbers are what they are.
For this use case, look at NRR by product line.
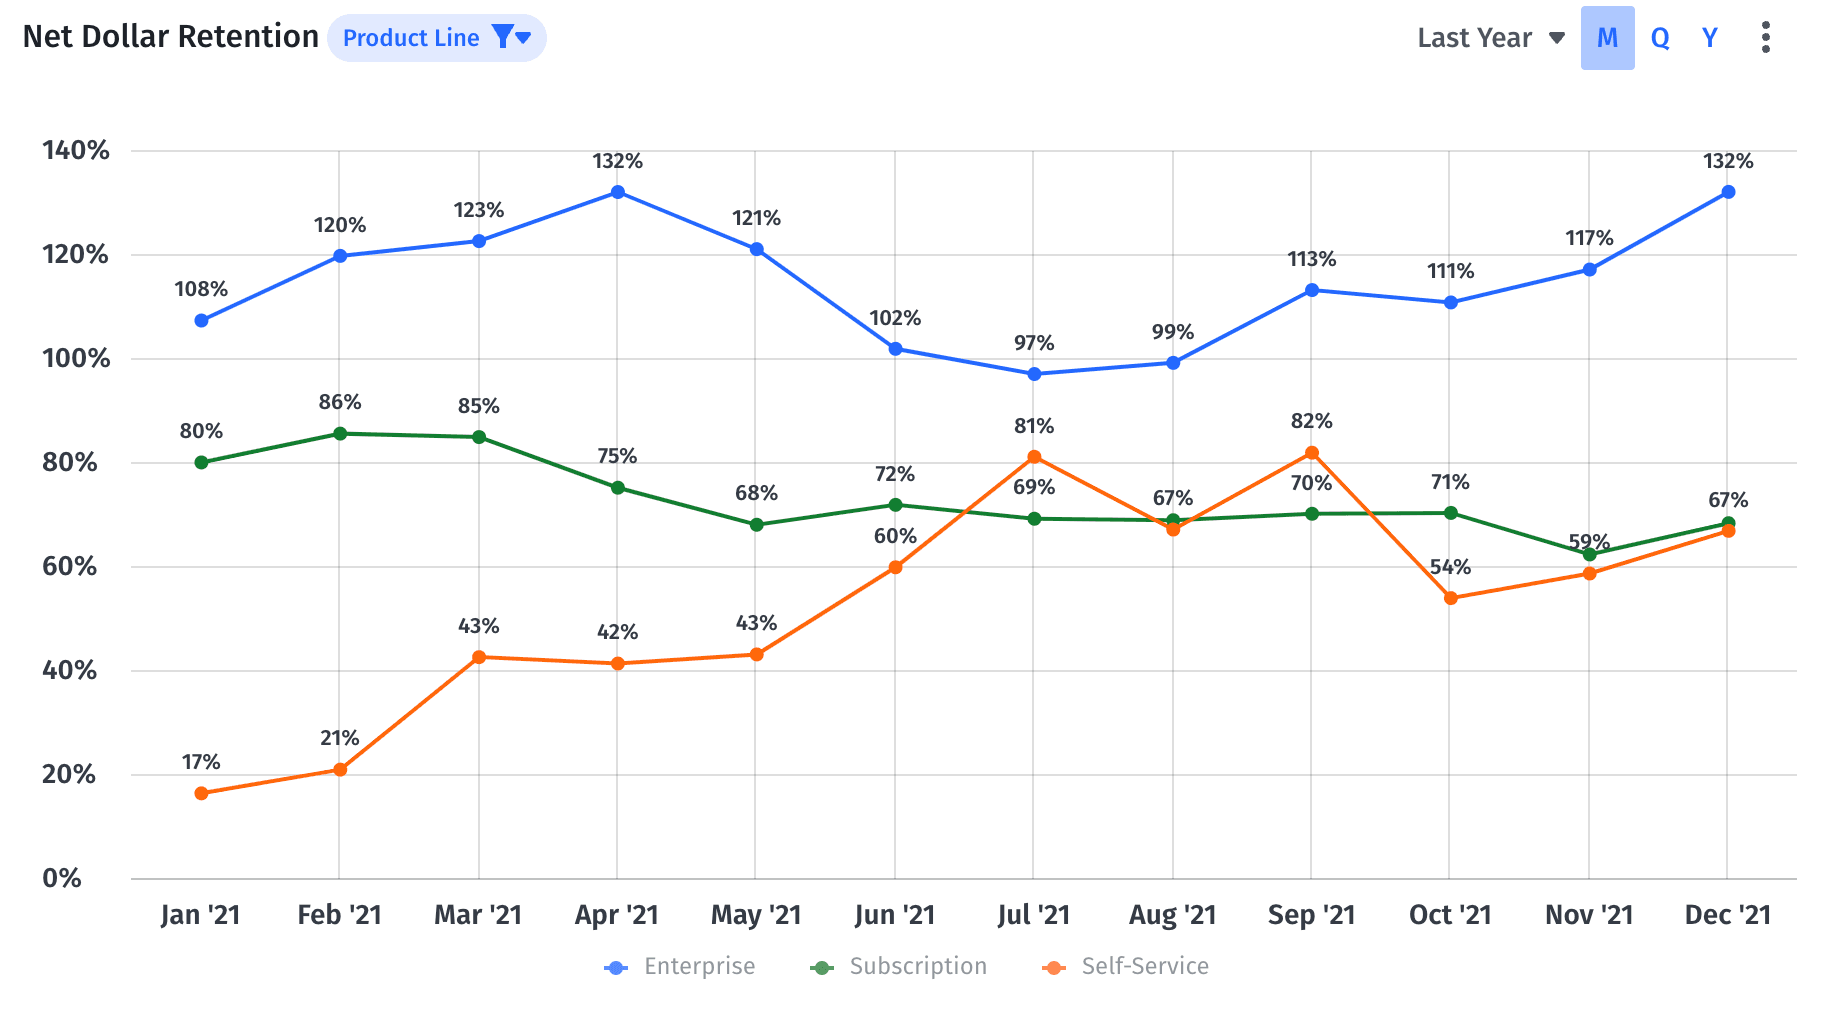
In terms of product line, we see that our enterprise customers show a healthy sign of retention — but subscription and self-service customer numbers are low, which could be dragging down overall NRR. That’s where finance needs to dive in further.
Step 3: Check Significance of Product Lines in Revenue
Calculating retention allows us to dive into how our existing customer base (and active users) contributes to ARR.
To look at that, we’re going to add an ARR Composition chart next to our NRR data. This view of the data shows whether or not the issues in subscription NRR have a meaningful impact on ARR.
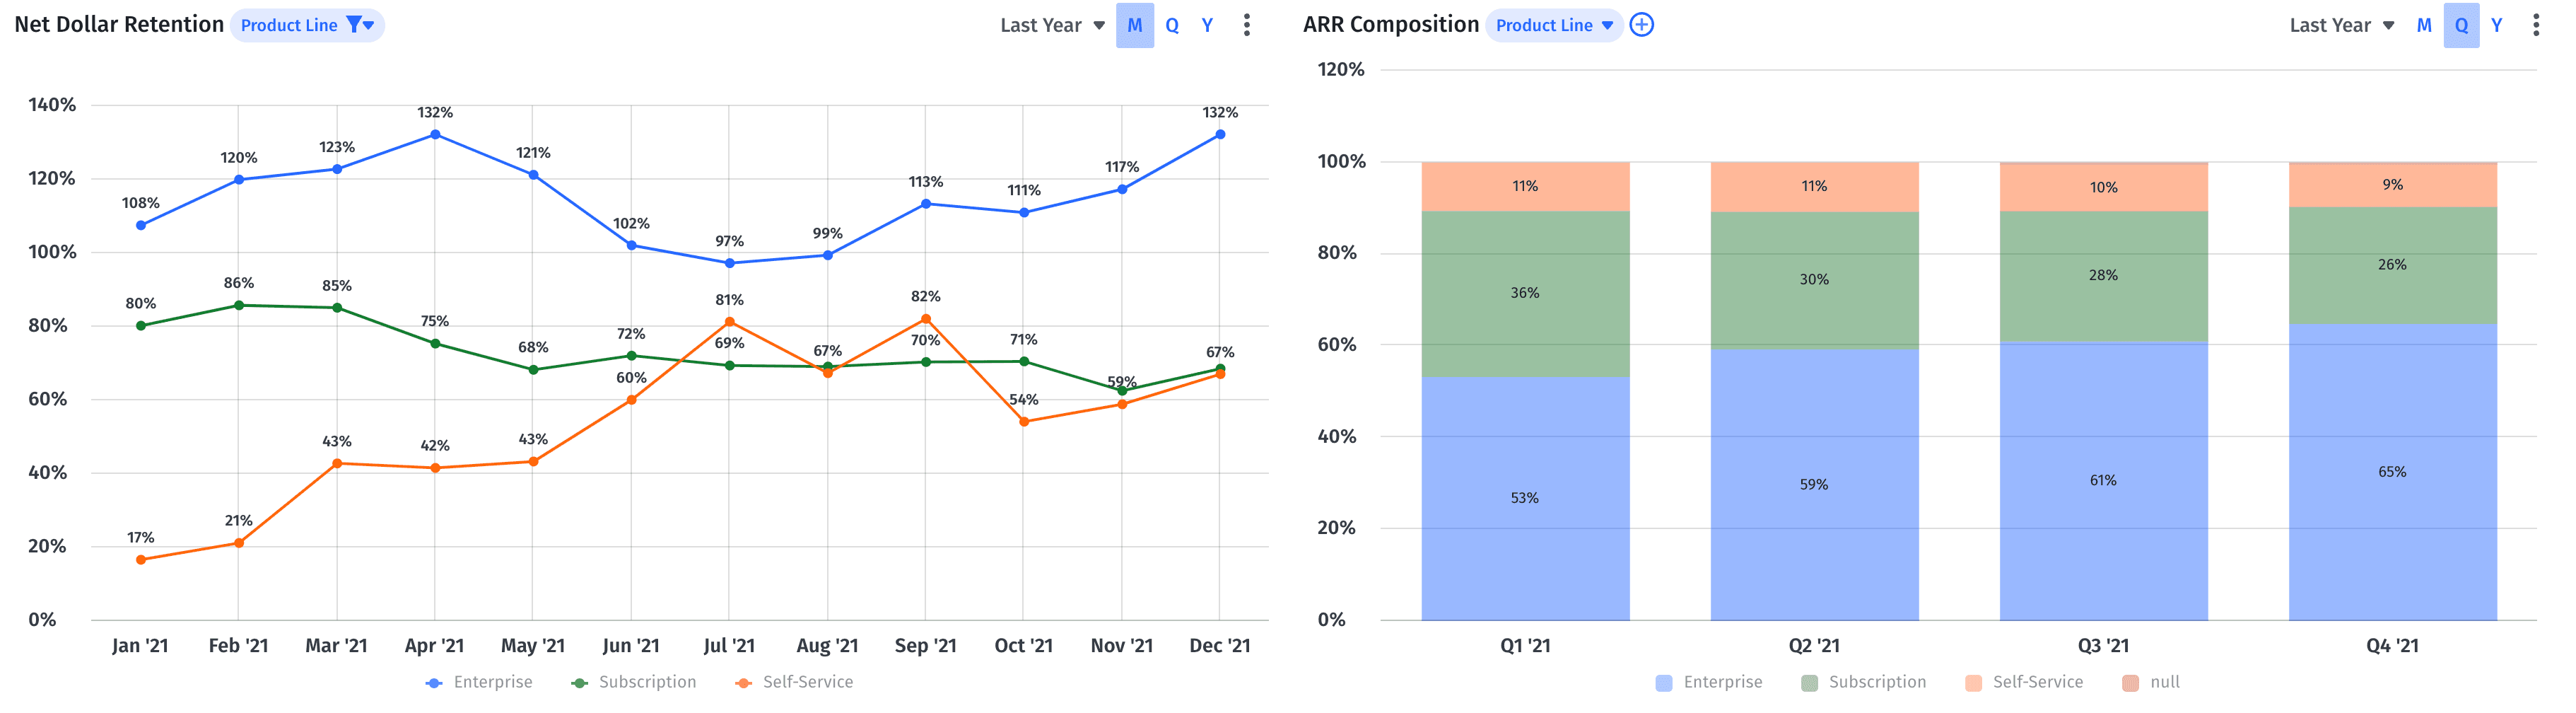
We’ll notice that subscriptions are, overall, a quarter of your business. That’s a meaningful impact with a low NRR. So, let’s look even deeper.
Step 4: Filter NDR Data by Subscription
You know NRR for your subscription business is struggling. Take your NRR data that’s filtered by product line and cut it even by adding another attribute to explore what could be going wrong. In this example, we’ll look at the filtered data by support tier.
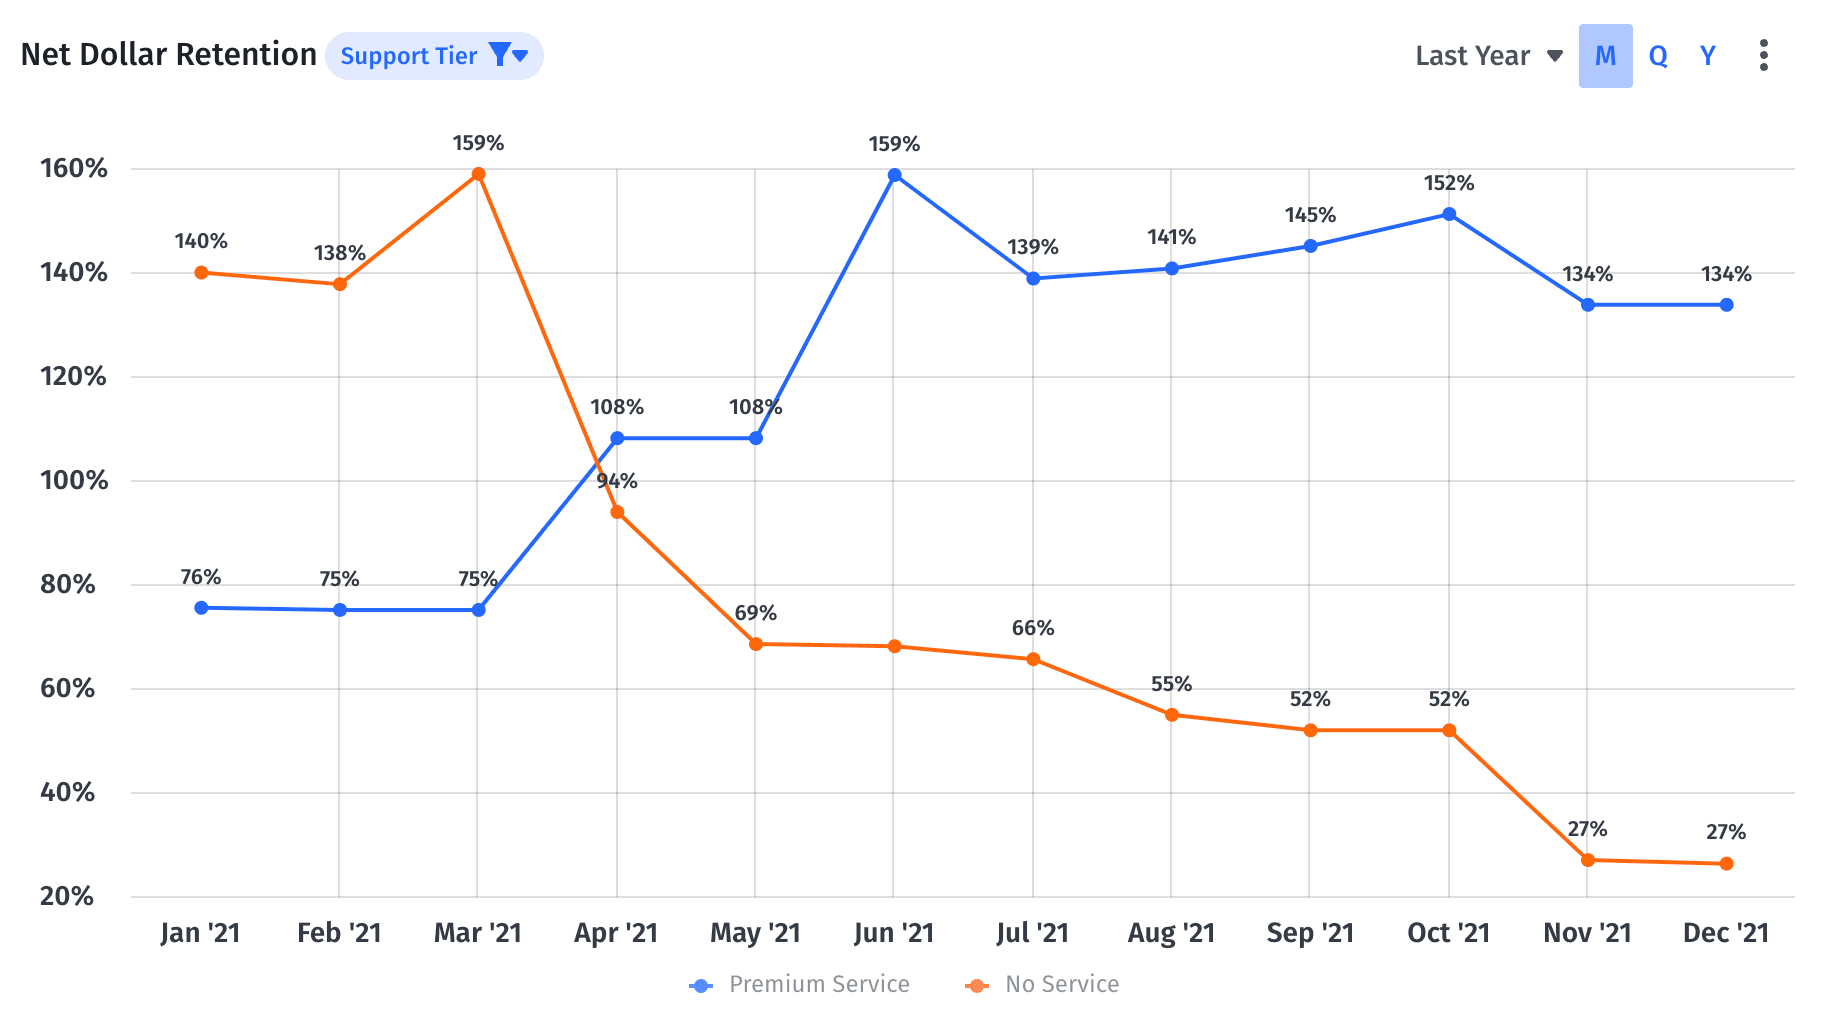
We’ve discovered a big dropoff in NDR for no-service customers. This is the turning point where you become a true strategic partner to your business. Take this information to customer success, support, and sales to drive conversations around retention strategies. Ask questions like:
- Why aren’t customers buying into our service plan?
- Is the service plan too expensive?
- Do customers feel the product should be easy enough to use without a service plan?
These conversations reveal the correlation between retention and service tiers that each department carries with them to have deeper strategic conversations about how to change your company’s product offerings.
Step 5: Go Further with Cohort Analysis
Steps 1 through 4 should give you a strong foundation for strategic conversations. But if you want to go even further to understand why users are churning, look at ARR by customer cohorts.
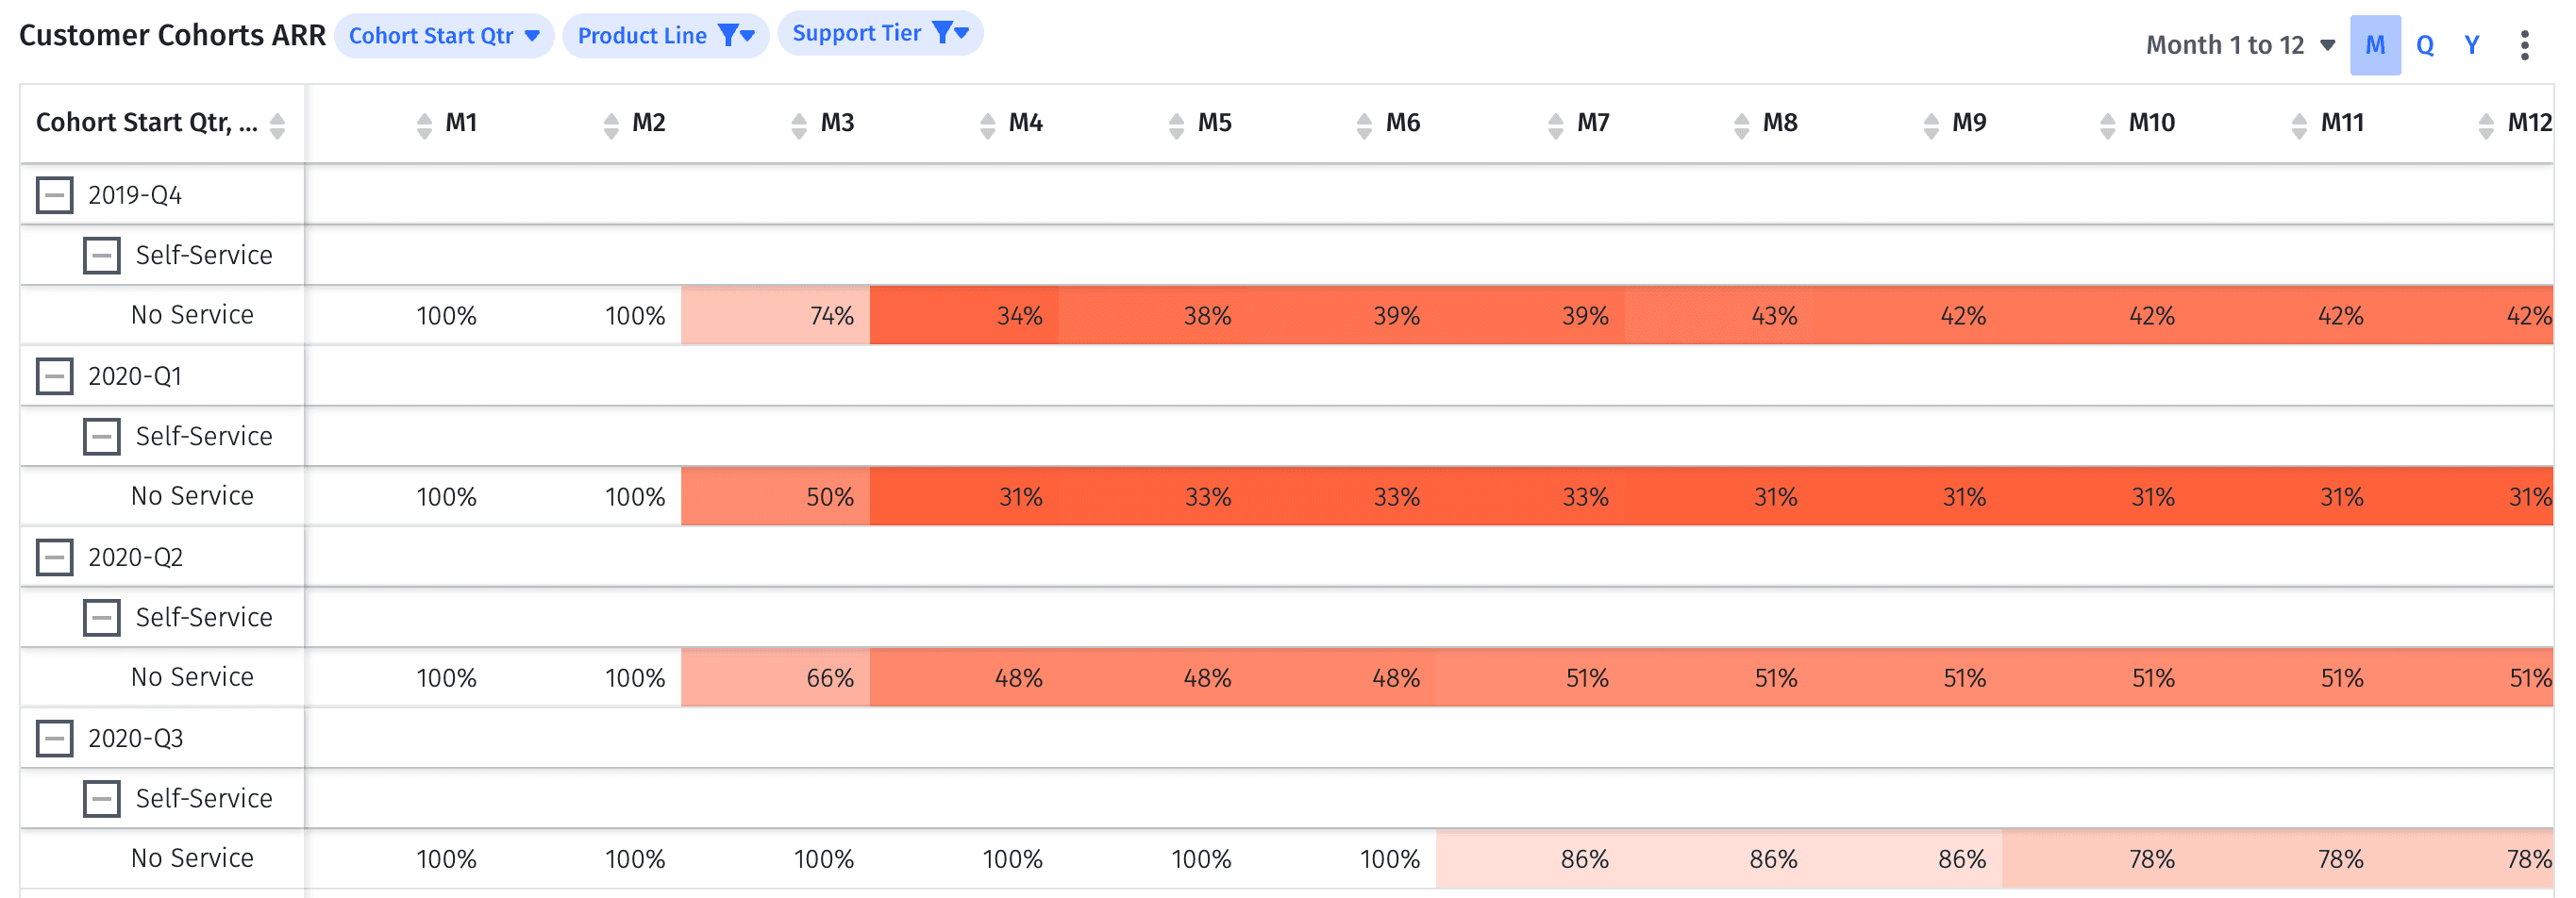
A cohort retention chart reveals real-time patterns of churn in the customer lifecycle. If you filter it for your subscription product line and no-service support tier, you can take a closer look at the same segment we used for our NRR analysis.
Say, for example, you have a clear dropoff after the first 3 months that these customers are on the platform.
This finding relates to issues occurring throughout the user journey: Are there onboarding issues with the product? Or are there early issues compounding because of service tier misalignment?
Customer service can then keep a closer eye on user behavior throughout the onboarding process, and relay feedback to the engineering team on any missing features or let sales know that they need to be roped in on a potential negotiation to ensure services are aligned.
Make Retention Analysis a Breeze
The end-to-end retention analysis walkthrough we just went through is a perfect example of the kind of work finance loves to do — but rarely has time for.
The amount of time and effort that goes into building a massive spreadsheet to analyze churn doesn’t give you the flexibility to dig into the “why” behind your retention numbers consistently. And constantly updating spreadsheets when new deals come in doesn’t allow finance to focus on cutting and visualizing the data.
Mosaic brings automation to the financial analysis process, eliminating all of that upfront manual work so you can get to the starting point faster. And from there, you can start playing around with different attributes and cutting the data to find strategic insights. Request a personalized demo, and discover how customer retention analysis can feel like a walk in the park.
Customer Retention Analysis FAQs
Is cohort analysis a worthwhile customer retention analysis methodology?
Cohort analysis is a critical technique for more advanced customer retention analyses. While a basic cohort analysis in Excel can give you general retention metrics for your business, cohort retention charts (like those found in more advanced analytics dashboards), let you look at customer data by both time and segment.
Running cohort analysis on metrics like ARR and net revenue retention helps you uncover strategic insights about:
- Stages of the customer lifecycle with higher churn rates
- How service tiers impact revenue and logo retention
- Which product lines are delivering the most value
- And how changes in the business impact different customer segments
What is a healthy customer retention rate in SaaS?
How do you calculate customer attrition?
What customer success metrics should businesses track?


Own the of your business.
