Workforce Planning and Management Metrics: 11 KPIs to Track
What Are Workforce Planning Metrics?
Workforce planning metrics gather information about your workforce which you can use to track and analyze team performance. These metrics should blend the financial and human sides of workforce planning, giving you a holistic view of the business.
By incorporating these metrics into your business operations, you have a chance to foster better working relationships, improve workplace communication, and create proactive plans for growing your business sustainably.
Categories
Table of Contents
The Importance of Workforce Planning Metrics
Workforce planning metrics are essential in ensuring your SaaS business stays relevant (and stays profitable). On top of preparing you to meet future challenges, workforce planning metrics also help you achieve your growth goals and attract new employees to your team.
Proactively Improve Workplace Culture
When you know what’s happening with employees and have a pulse on turnover and retention, you can better prepare for future challenges that might spring up.
Looking at rising rates of employee turnover prompts conversations with HR, who can then evaluate whether some of that loss is avoidable. They can then collaborate with other departments to further investigate why employees have resigned, then make any necessary changes to mitigate employee resignations and retain more staff over longer periods of time.
Plot Sustainable Paths to Achieve Growth Goals
Along the same lines as easing employee challenges, workforce planning metrics also help your company achieve its growth goals. As your business evolves and expands, you need to solidify your headcount planning trajectory to match your stage of growth (and headcount planning software can help with this). Questions like what the optimal manager-to-direct report ratio is for different roles and what each department’s onboarding and expected ramp rate are what allow finance to keep track of operational efficiency.
Workforce planning metrics offer visibility into the entire hiring lifecycle so you know whether you’re hiring the right number of people, at the right time, and with the right salary range. When all of these factors and human capital allocation align, your company sets a foundation for efficiency at all stages of the hiring process — from onboarding to full productivity to individual ROI per employee.
Attract New Employees
Recruiting new members of your workforce should be proactive, not reactive. Companies experiencing hypergrowth can’t wait until employees are terminated (or until they hand in their two weeks) to think about new hires. Instead, HR needs to be in a position to actively work on the front end to attract the talent and skill set the company is looking for — and that approach largely involves workforce planning metrics.
An overlooked benefit of planning metrics within a SaaS business is that they help set standards that attract new employees in the first place. Not only do these metrics help you develop competitive salary bands (and implement these bands based on leveling), but they also ensure your company is keeping pace with other competitors in your industry.
Plan for company growth with our Financial Planning Blueprint.

11 Workforce Planning Metrics to Track
While there are plenty of workforce metrics out there for your company to track, some tend to carry more weight and importance than others. Among the most critical metrics for your success are turnover rate, attrition rate, ramp rate, and total headcount. Many companies use workforce planning software to keep a close tab on these metrics.
1. Turnover Rate
Turnover rate represents the number of employees who leave your company and who you want to replace with either internal talent or outside hires. The formula for turnover rate is as follows:
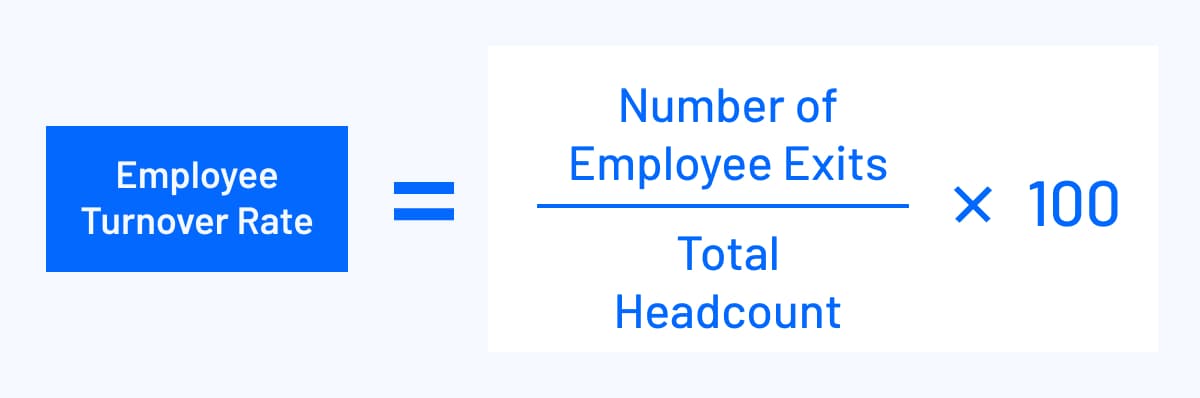
To take things a step further, you can also calculate voluntary and involuntary turnover rates on their own. This way, you can determine the percentage of employees who leave for personal reasons versus those your company chooses to let go.
Voluntary turnover can happen for a variety of reasons, though some common triggers include a lack of recognition (or feedback) from workforce management, a toxic workplace environment, or the inability for career advancement and feelings of stagnation.
Involuntary turnover (i.e., layoffs and terminations) is often due to poor employee performance, violation of company policies, or failure to pass a probation period. In any of these scenarios, a high turnover rate could create space to bring in more qualified team members.
2. Attrition Rate
Attrition rate is somewhat similar to turnover rate, but with one key difference. With attrition, employees leave your company voluntarily, but you don’t seek to refill their position afterwards. The formula for attrition rate is as follows:
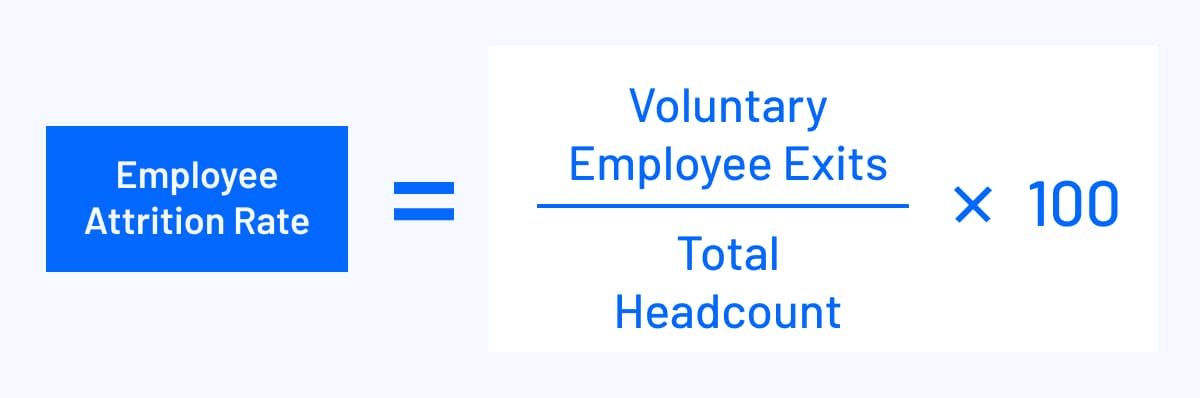
Although reasons for attrition can vary, it’s often associated with retirement, resignation, returning to school, or even personal health reasons.
Note that if your company doesn’t balance its attrition rates, it could lead to staff downsizing or workforce aging. One of the best ways to prevent high attrition is by investing in retention programs that’ll keep talent at your company (and keep them reaching their full potential).
3. Ramp Rate
Ramp rate measures how long it takes new employees to transition from onboarding to full productivity levels.
Ramp rate will be unique to every role. But one of the most critical use cases for this metric is in sales hiring and sales capacity planning.
When you know how long it takes to get a sales rep up to speed, then you’ll also know when you need to hire to meet your revenue goals. The reality is, coaching and onboarding new hires takes time and energy away from other employees — so the faster your sales reps can get going on their own, the faster your whole team will be on the road to success.
4. Total Headcount
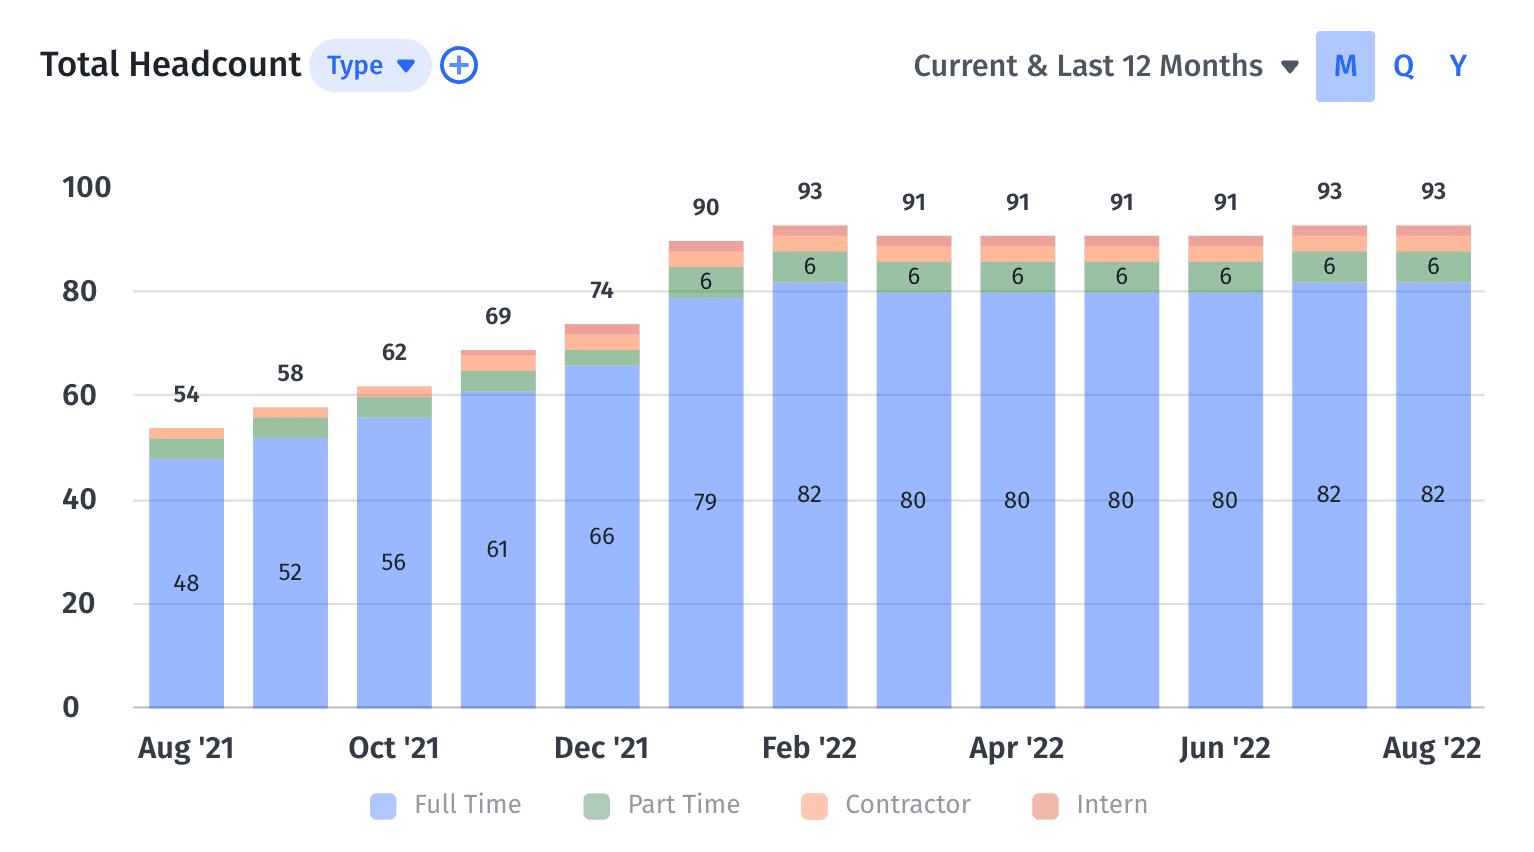
Total headcount provides a quick overview of your total workforce at any point in time, whether those employees are categorized as full-time, part-time, contracted, and so on. This is one of the simplest metrics your company can monitor. But despite its simplicity, total headcount is important because it highlights whether your business is on track to hire the right number of people who can support your growth plans.
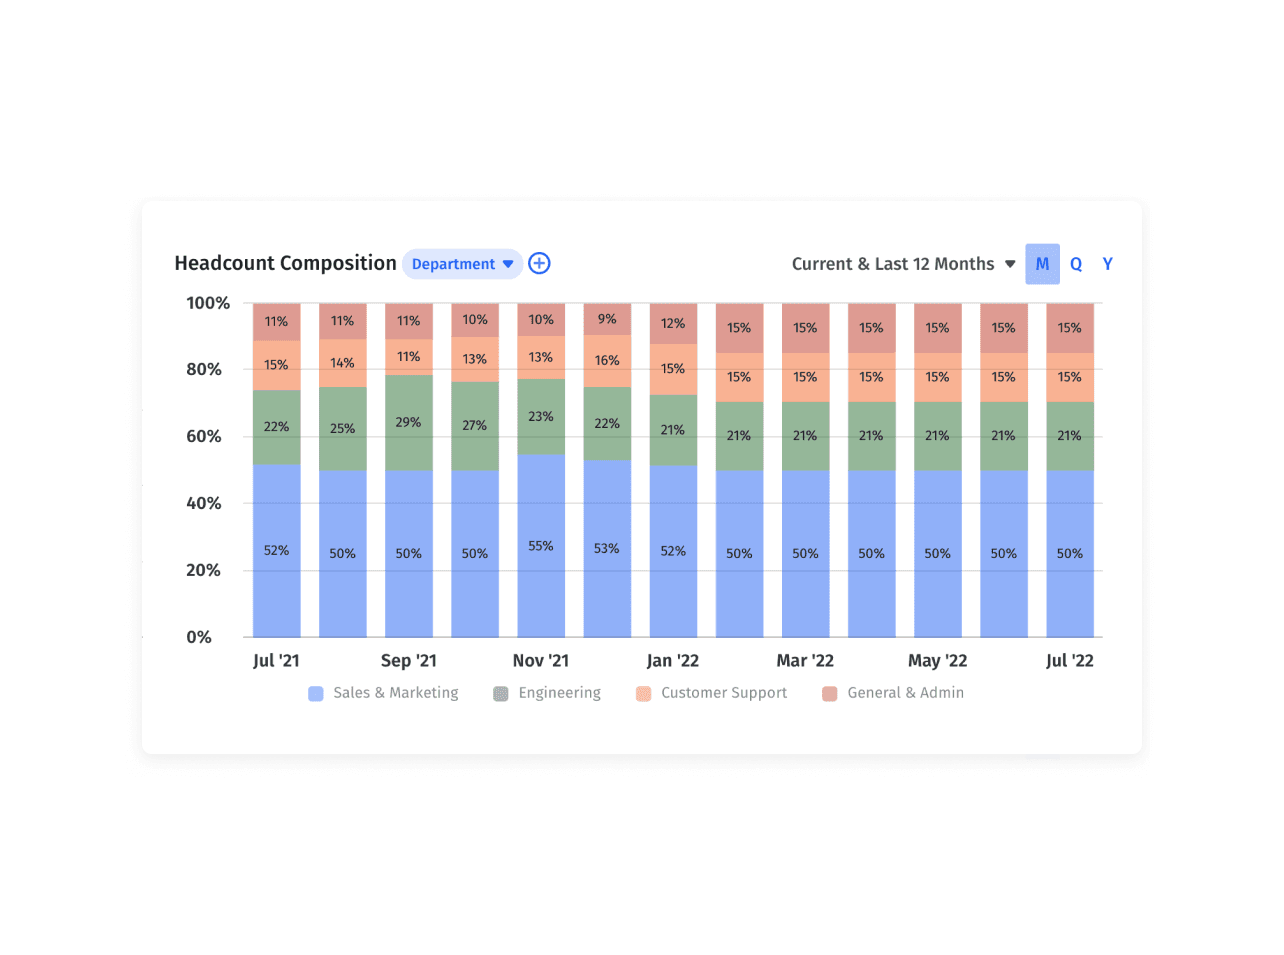
To expand the insights you receive from total headcount, you can actually track the distribution of employees in each department or division unit.
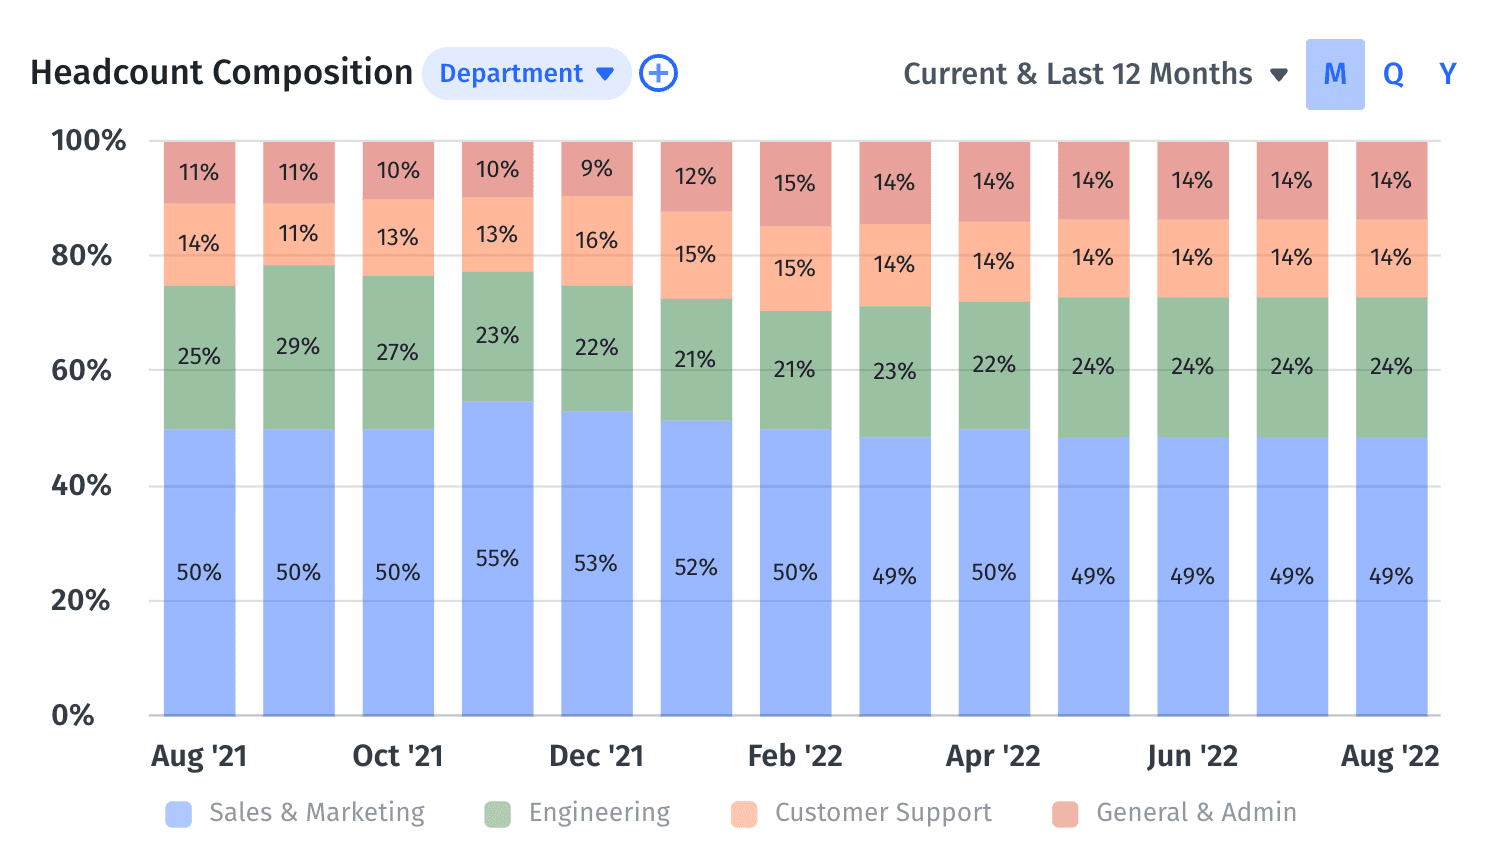
In doing so, your HR professionals are able to identify critical bottlenecks like understaffing or staff overages.
5. Employee Net Promoter Score
Your employee net promoter score (eNPS) is a method for measuring employee experience and how they feel about your company. The employee NPS is based on the concept of Net Promoter Score, which is a standard measurement of customer loyalty. In short, eNPS indicates levels of employee engagement and the likelihood that they’d refer others to the company for work.
HR departments should conduct eNPS surveys at least once a year — though some companies send out these surveys as often as monthly or bi-monthly. Most eNPS questionnaires ask employees to provide answers on a scale of one1 to 10, where they rank how likely they are to recommend your company to others in their immediate circle.
6. Time-to-Hire
Time-to-hire is a strategic HR metric that assesses the average time spent onboarding new talent. To calculate this metric for a specific employee vacancy, you need to know: the day you opened up the position, the day the first candidate applied, and the day when a candidate formally accepted your offer. All of these stipulations factor into the total time-to hire.
Ideally, this metric would be as low as possible — meaning it takes the least amount of time for human resources to complete the entire onboarding process.
To speed up time-to-hire, your organization will need to build a positive image among external audiences, implement incentives (like referral bonuses) for your existing workforce, or offer an unbeatable salary and benefits package.
7. Salary Scale Distribution
Salary scale distribution describes the range of wages you pay a new hire in a particular role. Salary scales are normally calculated using a combination of the average wages for a position, the location, and the pay band where that position falls.
Salary scales serve as a reflection of the minimum and maximum salaries you’d pay a candidate for an open position. The lower end of salary distribution is what you’d pay someone who meets the minimum competencies of the role — whereas the opposite end of this scale is what you’d pay a high performer who checks all your boxes and is considered an exceptional hire.
Salary scale distribution is an important example of workforce planning, as tracking this metric helps inform decision-making about where your company’s current salary bands need work.
8. Tenure Distribution
Tenure distribution is the average time employees stay at your company.
This benchmark becomes increasingly important as your organization matures. A startup approaching seed and Series A funding will have noticeably low tenure distribution. But as the company continues to grow, there’ll naturally be some turnover — which allows you to gauge the average length of employment.
If your company’s tenure rate is high, it indicates positive retention and employee engagement, and likely points to a large number of people who’ve advanced into senior roles. The formula for tenure distribution is as follows:
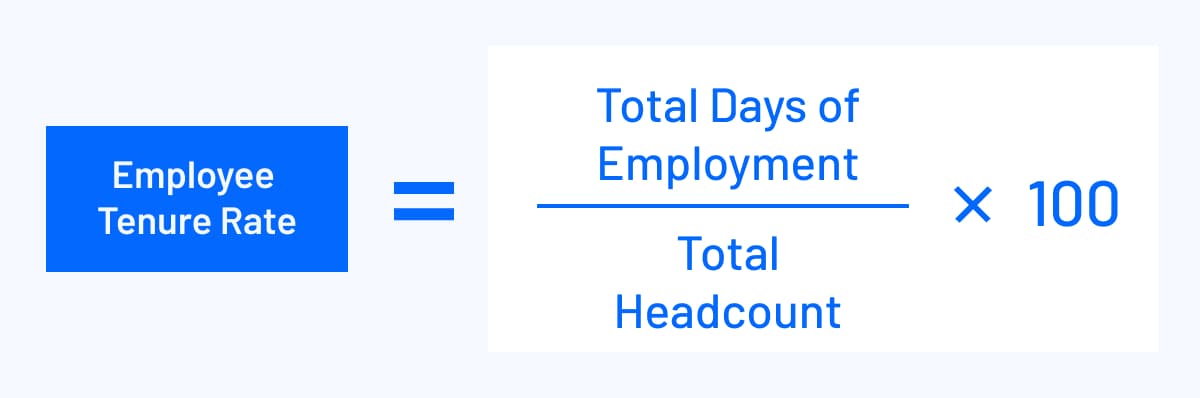
Note that the total days worked can be an average of days, months, or years.
You can also calculate tenure distribution for certain demographics or positions within your company. Doing so offers incredible insights into where you have room for improvement as well as where there’s potential for internal mobility between roles as careers develop.
9. Employee Retention Rate
Employee retention rate shows how successful a company is at retaining employees over a designated time period (like a fiscal quarter or a full calendar year).
To accurately calculate your retention rate, you’ll need to know the exact number of employees on the first day of that accounting period — so you can determine the exact number of employees who also departed during that time.
The higher your organization’s retention rate, the better. For the most part, companies with high retention rates are those who prioritize connection and communication and who place a strong emphasis on team culture and values.
10. Average Revenue per Head
Average revenue per head, or average revenue per employee (RPE), is an efficiency ratio that tells you the revenue every full-time employee generates on average. RPE doesn’t account for any outsourced work or contractors you might use. The formula for average revenue per head is as follows:
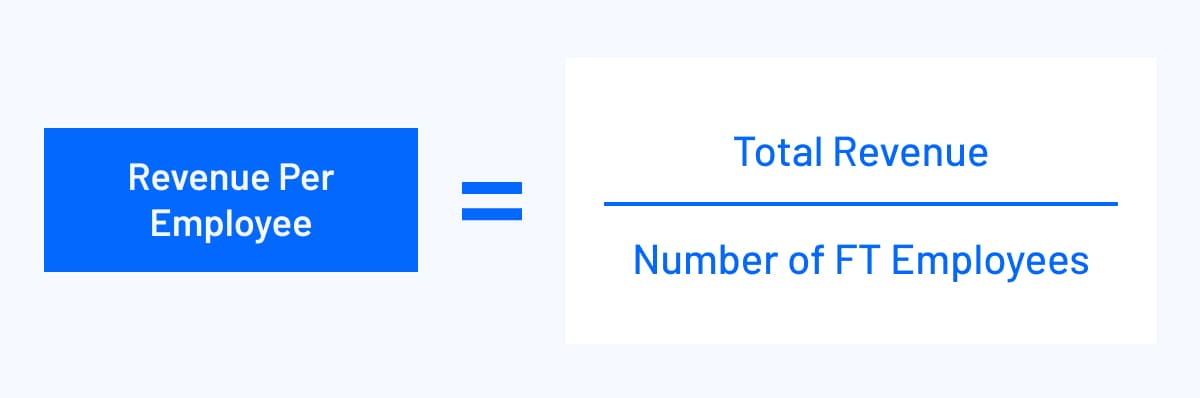
With this calculation, you’ll get an estimate of how much money each individual employee is generating for your company. The RPE ratio is especially helpful when looking at historical changes within your own company, or when comparing rates to competitors in your industry.
High-growth companies are wise to pay attention to RPE, since they need to know that their headcount investments are on track with their revenue growth goals.
11. Employee Absentee Rate
Employee absentee rate is the amount of unplanned absences due to illness and other relevant causes. This metric of HR analytics can be tailored for individuals, teams, or across the entire organization. The formula for employee absenteeism is as follows:
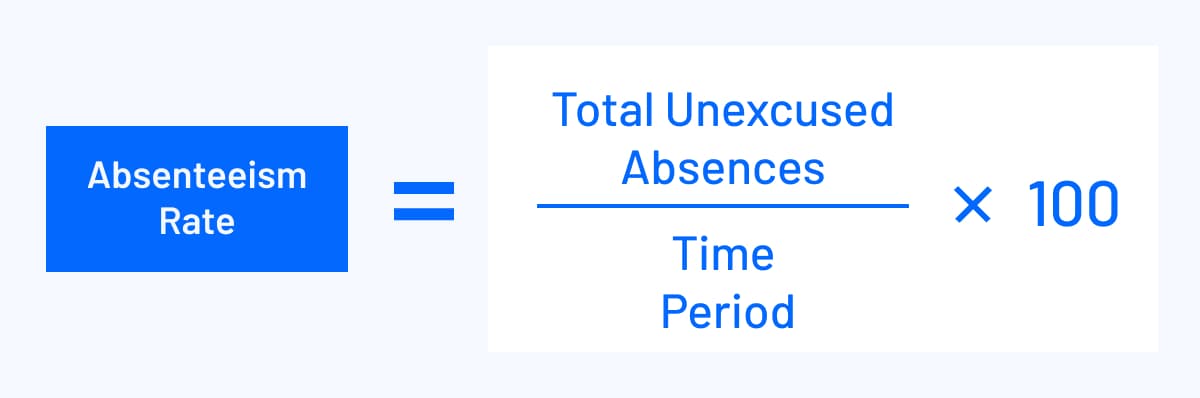
A high absentee rate can signal a lot of unproductive hours, which should trigger you to take preventive or corrective measures.
As your company continues to grow, this metric increases in importance. Eventually, it may impact your policies around time off during the holidays — like closing your offices the last week of the year, for example.
Monitor Workforce Planning Metrics with Mosaic Dashboards
Need help monitoring your workforce planning metrics? Let Mosaic do the heavy lifting for you. By teaming up with Mosaic, your company has access to dashboards and metrics that are essential for both talent management and the strategic workforce planning process.
Mosaic integrates with your HRIS to offer real-time headcount data, which serves as the driving source system behind reaching all your growth and revenue goals. But on top of helping achieve your goals, this data also improves partnerships with HR so you can tackle broader workforce planning.
If your company is ready to elevate its workforce planning metrics, request a personalized demo today.
Unlock a Smarter People Strategy

Workforce planning metrics frequently asked questions
How can workforce planning metrics help improve financial performance in a business?
Tracking workforce planning metrics helps companies improve financial performance by identifying areas for improvement, optimizing staffing levels, and streamlining workforce management processes. This leads to reduced labor costs, increased productivity, better talent retention, and overall better financial performance.
What are some key workforce planning metrics that businesses should track?
How can Mosaic help with tracking and analyzing workforce planning metrics?
Explore Related Metrics


Own the of your business.
