Sales Funnel Metrics
What Are Sales Funnel Metrics?
Sales funnel metrics are key performance indicators (KPIs) that test the efficiency of customer acquisition. These metrics prompt collaboration between the sales and marketing teams to consider where to improve the marketing strategy and sales process while also keeping a financial perspective on department spend and budget allocation down the line.
Categories
Your sales funnel is a stage-by-stage representation of your new-business pipeline — the journey from net new lead all the way to closed-won opportunities when a new customer signs on.
While the sales funnel focuses on your company’s marketing efforts and the sales team’s efficiency, finance can still pull sales funnel metrics together that build the company’s growth narrative, describe the customer journey to investors, and keep the company’s revenue goals top of mind.

10 Must-Know Sales Funnel Metrics
Sales funnel metrics can be broken into three categories: top of the funnel (TOFU), middle of funnel (MOFU), and bottom of the funnel (BOFU). Understanding where sales funnel metrics fall into these categories allows for deeper collaboration between sales, marketing, and finance to ensure the most actionable insights and strategic decisions when it comes to the customer journey.
- Top of funnel, Stages 1 and 2: Awareness and interest. The top stages of the sales funnel are stages of the “marketing funnel,” in that marketing efforts build potential customers’ interest and awareness across various touchpoints. Marketing will focus on social media engagement, ad impressions, and overall website visits.
- Middle of funnel, Stages 3 and 4: Consideration and intent. Mid-funnel is the next stage of the funnel where prospective customers start to express more consideration and intent for the product or service by signing up for your company’s email list. It’s then up to your outbound efforts, email marketing, and other programs to entice potential customers to take the next step and provide their contact information or perform specific actions to then become marketing qualified leads (MQLs) or sales qualified leads (SQLs).
- Bottom of funnel, Stages 5 and 6: Evaluation and purchase. Your bottom-of-funnel efforts are where your sales team guides prospects through the sales pipeline to evaluate and initiate the buying process to hopefully purchase your product or service.
While finance teams can evaluate efficiency across the entire funnel by analyzing conversion rates at various stages, the bottom of the funnel is where finance often focuses most. It’s where metrics like closed-won and closed-lost deals, deal conversion rates, sales closing ratio, average deal size, and more come into play, directly impacting top-line planning. Bottom-of-funnel insights further fuel other metrics and financial responsibilities across the company, such as revenue forecasting and budget planning.
While the marketing team will monitor most top-of-funnel sales metrics through systems like HubSpot, many middle and bottom-of-funnel metrics are in your customer relationship management (CRM) platform and systems like Salesforce. And as these stages of the sales funnel overlap with your sales pipeline, many of these metrics overlap with sales pipeline metrics and sales performance metrics.
Here are the 10 most important metrics to consider when evaluating your sales funnel performance.
1. Total and Type of Leads
Tracking the total number of leads and identifying how they enter the sales funnel is extremely valuable information for marketing and sales teams.
Marketing wants to know the campaign or content marketing effort that drew the potential customer into the funnel, such as an ebook download or repeat visits to the company blog. For sales, leads provide their contact information and express interest in learning more about the product or service. This information may be provided via a contact form on a landing page or a direct email or social media message to a sales representative.
Finance can break leads into cohorts to validate MQLs vs. SQLs to provide insight into what branch of the sales funnel is performing well and prompt teams to discuss where improvements can be made.
Marketing may look at their top-of-funnel marketing campaigns to ensure they draw plenty of potential customers that meet the ideal customer profile (ICP). Sales can collaborate with marketing and across their own team to ensure everyone understands the ICP before pursuing prospects to schedule a demo. Ensuring qualified leads also helps to conserve the sales team’s time, which factors into CAC and the eventual CAC payback period if the prospect converts into a customer.
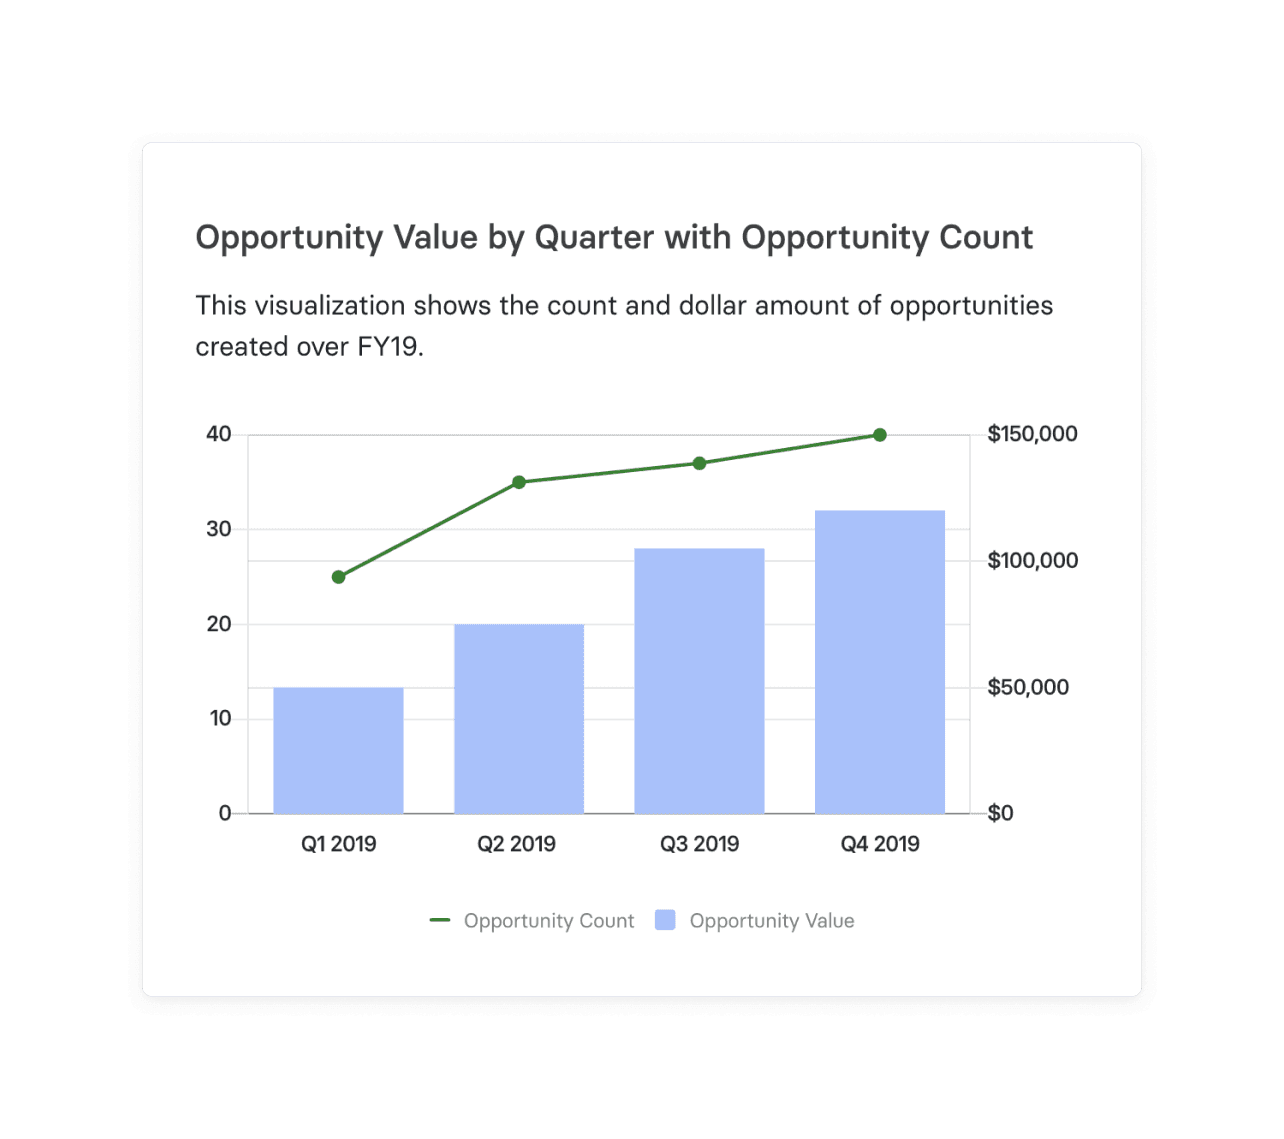
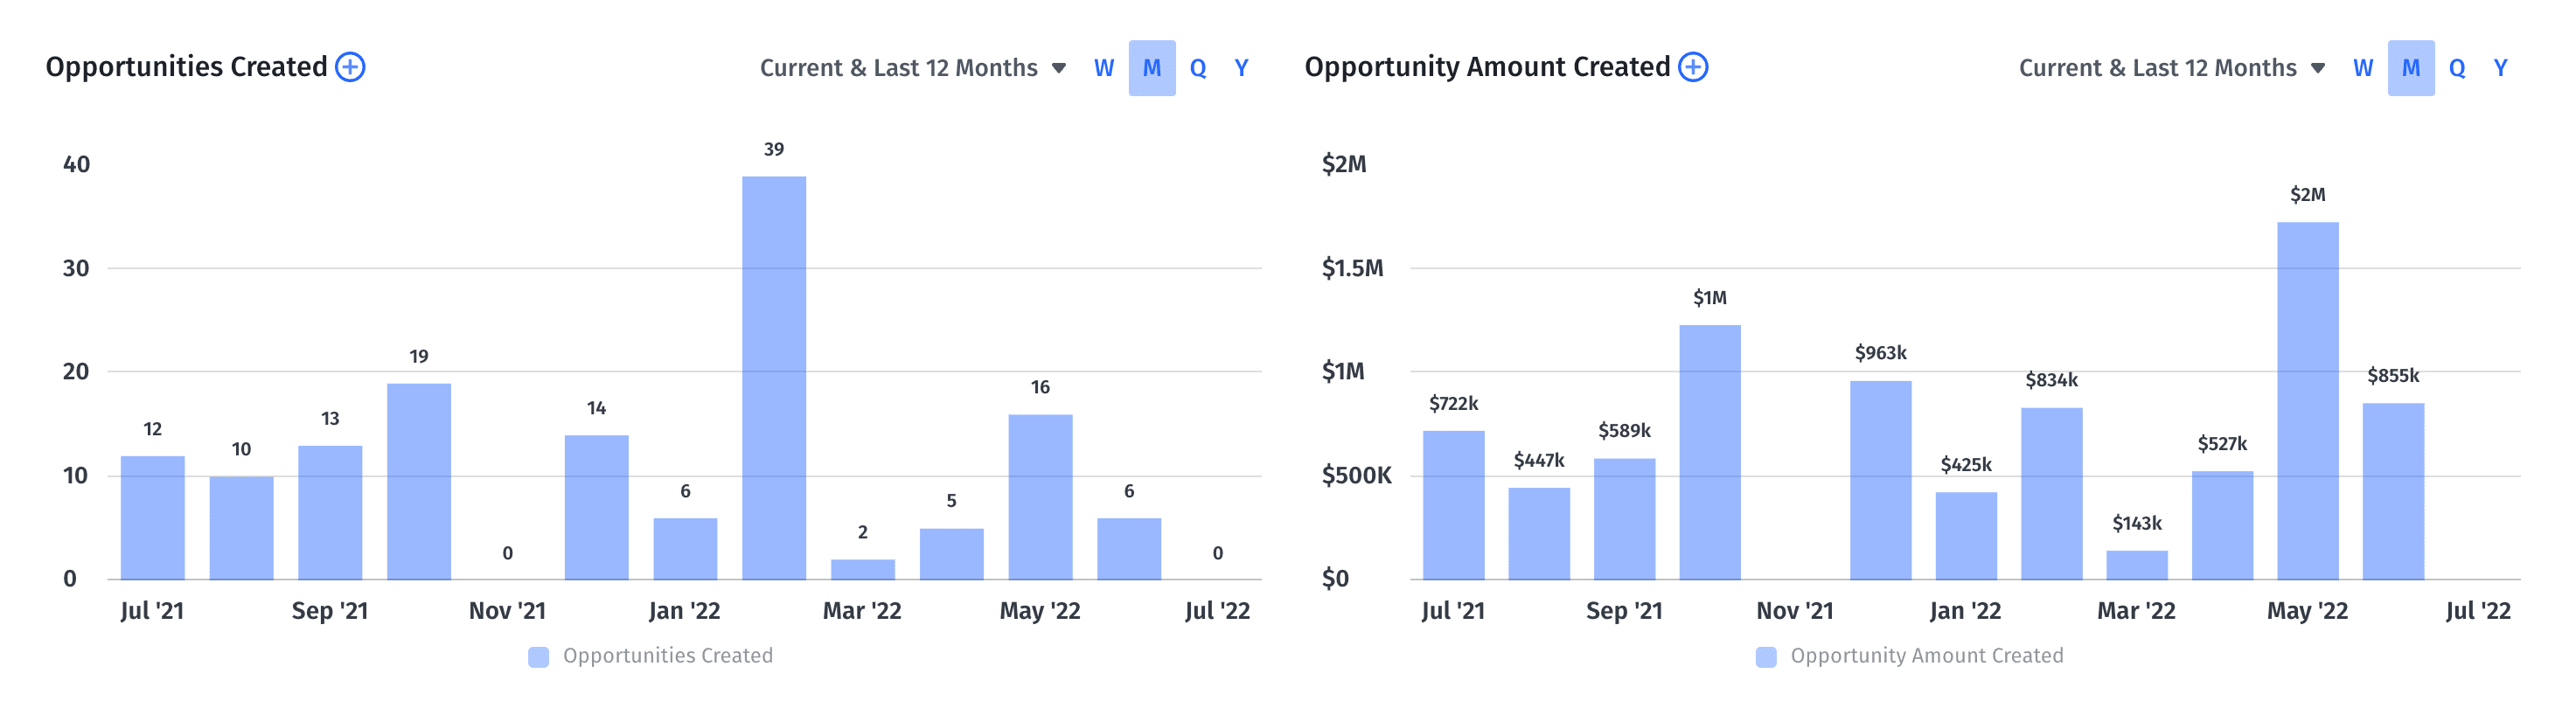
2. Opportunities Created
Opportunities created is the number of deals created in your CRM within a given period. It’s a critical metric that fuels sales pipeline projections and subsequently predicted revenue from converting prospects to paying customers.
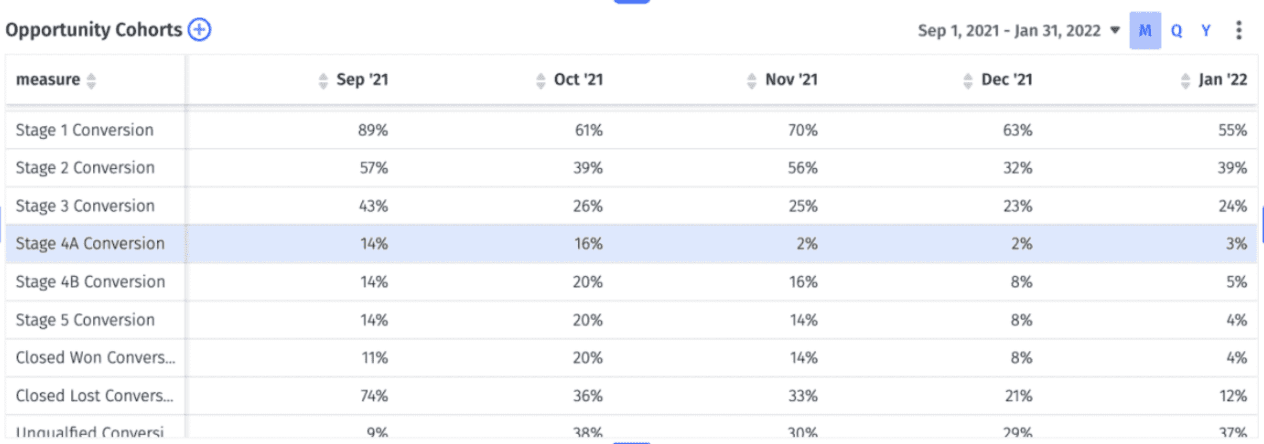
You can take this metric one step further by conducting a customer cohort analysis that focuses on opportunities at each stage of the sales pipeline. Remember that this cohort will be made of mid-funnel opportunities, meaning prospects have become qualified leads. You can then focus on the stage that sees some dropoff, alongside measuring the effectiveness of marketing campaigns in a given period.
As the mid-funnel stages act as the entrance into the official pipeline, you can drill into this metric further by calculating your pipeline conversion rate. Divide your total number of conversions by the total number of leads, then multiply by 100 to get a percentage.

3. Stale Pipeline List
A stale pipeline list is a list of opportunities in the pipeline with an “open” stage yet a close date.
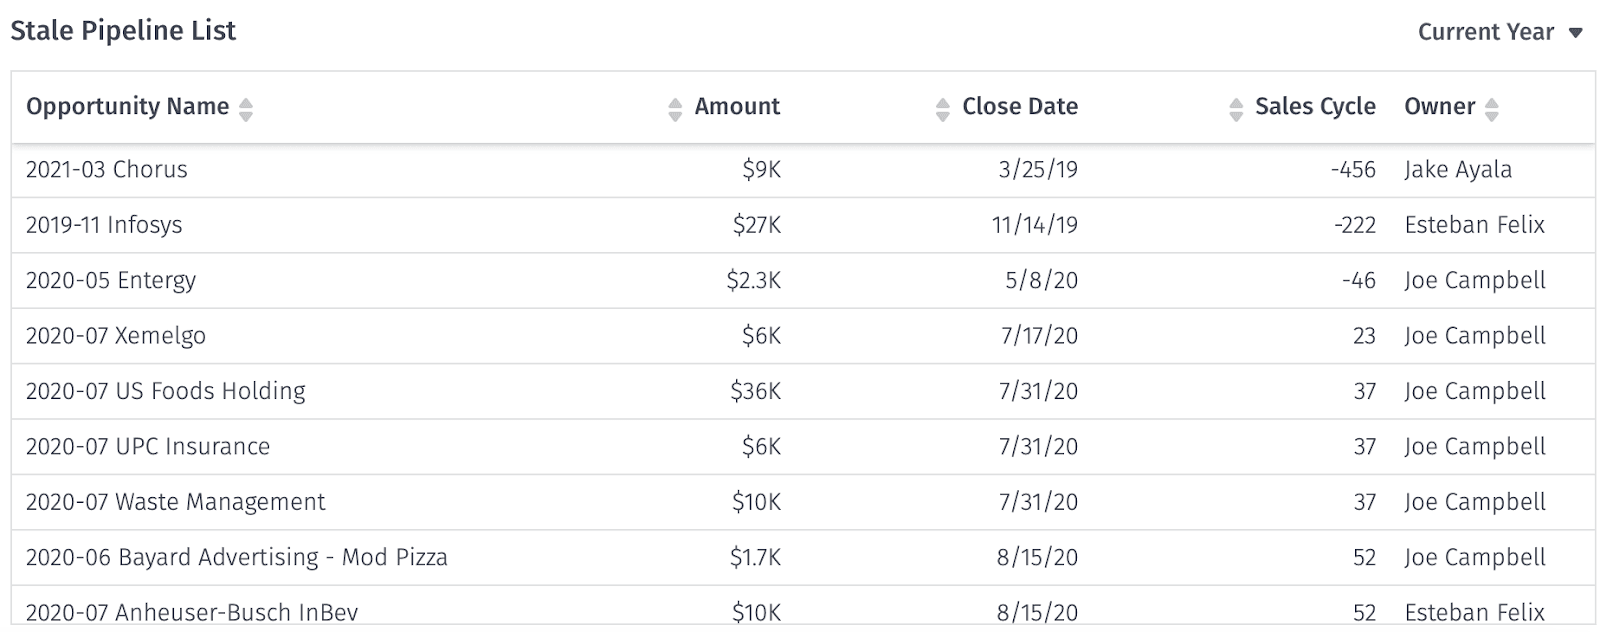
The list serves as a checkpoint as it impacts the customer experience and operational metrics like CAC and customer lifetime value (LTV or CLV). While the sales team can update the deal details in the CRM, they can also evaluate why particular customers are stuck within a stage and figure out how to push them through to match their average sales cycle timeline.
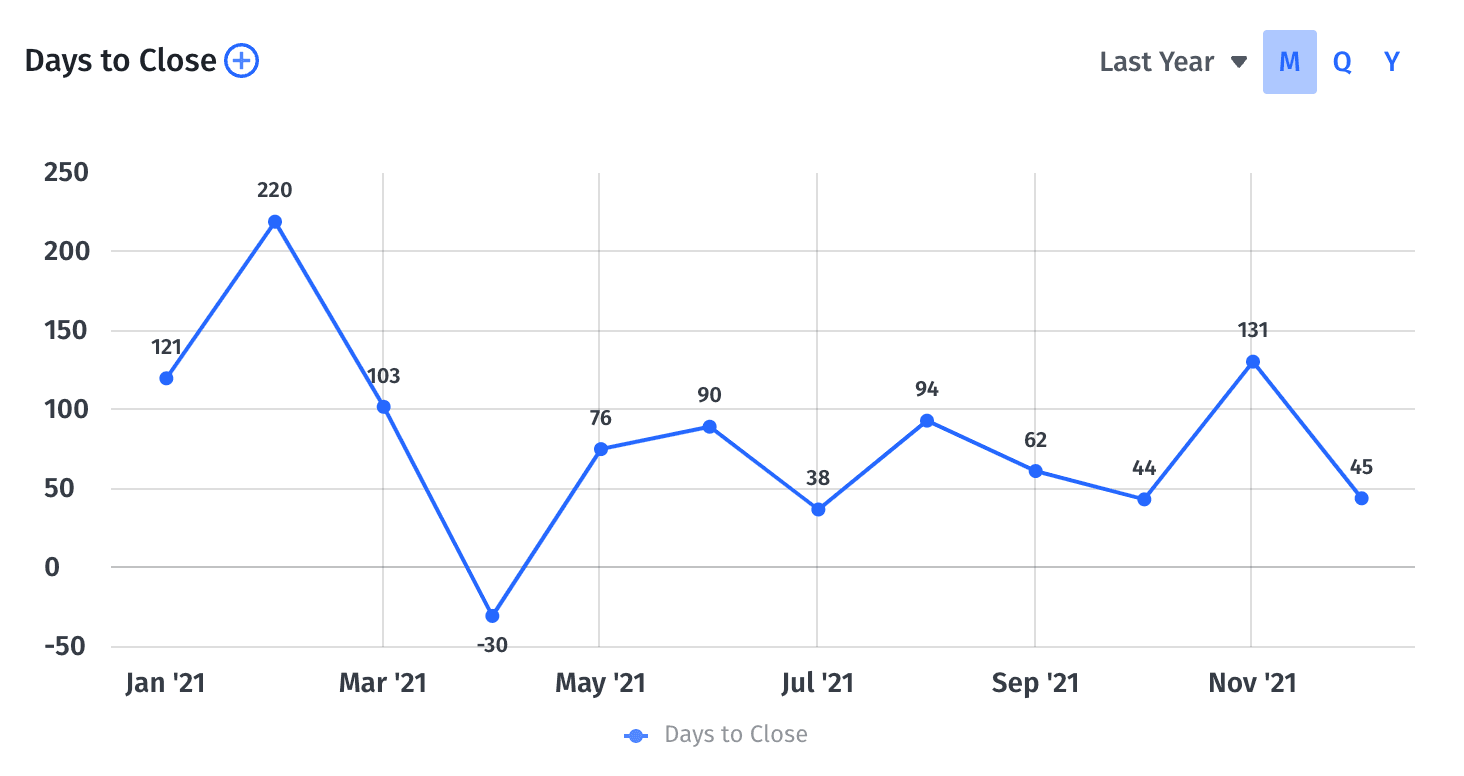
4. Average Sales Cycle
Your average sales cycle is the average amount of days between a created date and closed date for closed-won deals. To calculate it, take the total days and divide it by the number of won deals for a given period of time.
While the sales cycle length varies due to industry, product, and price, the SaaS industry has an average sales cycle of 84 days.
Knowing your average sales cycle helps you evaluate your sales efforts and inform your sales strategy. Marketing can ensure that there’s a robust collection of content marketing assets that conveys the product or service’s value proposition and helps push potential customers through the funnel.
5. Deal Conversion Rate
Your deal conversion rate compares your closed deals to opportunities to analyze the sales and marketing team’s effectiveness throughout the sales cycle.

For finance, the deal conversion rate provides a high-level view of product/market fit and reasons for closed-won and closed-lost deals, which you can then explore with the sales team to encourage feedback across the company. Marketing and sales teams may update this calculation by slightly changing the formula. For example, marketing may look at unique visitors (instead of leads) to a landing page and compare how many conversions (the ideal action, such as a download or list signup) the page brings in. Knowing your deal conversion rate also helps with calculating important sales forecasting metrics like weighted sales pipeline.
6. Win Rate
Your win rate is the final stage of your overall sales funnel conversion rate. To calculate your win rate, take your closed-won deals and divide by the total closed deals (wins, losses, and disqualifications) in a specific time period.

This sales funnel metric considers marketing and sales team efficiency, as well as larger business trends. If your CRM setup includes a field for reasons why deals are lost or disqualified, the sales and marketing teams can evaluate factors like competitors, timing, and pricing and work through solutions to improve win rate.
7. Average Deal Size
Your average deal size serves as a great predictor for total revenue growth, as it helps to uncover deeper insights into the sales process, sales pipeline, and sales team performance. For the sales funnel, finance can help recognize opportunities with a high chance of conversion.
To determine your average deal size, take the sum of closed-won opportunities in a specific time period and divide it by the total number of deals made within that period.

If your average deal size is $75,000, for example, an opportunity worth $70,000 has a higher chance of conversion than an opportunity worth $90,000. Yet you can easily pursue both, as long as the sales team calculates any risks associated with the larger deal.
Average deal size also builds awareness around qualifying leads. Marketing and sales can evaluate the types of deals they’re bringing in and continue to update the ICP to ensure accurate qualification and detection of any red flags.
8. Sales Velocity
Sales velocity gets into the granularity of understanding how much total revenue you’ll bring in per day with the company’s current pipeline and performance. The calculation considers the multiple of your number of opportunities, average deal size, and win rate against your sales cycle.

Understanding your sales velocity sets up more realistic quotas, allowing you to pace headcount planning in terms of growing the customer success team to have enough representatives to support your customer retention numbers.
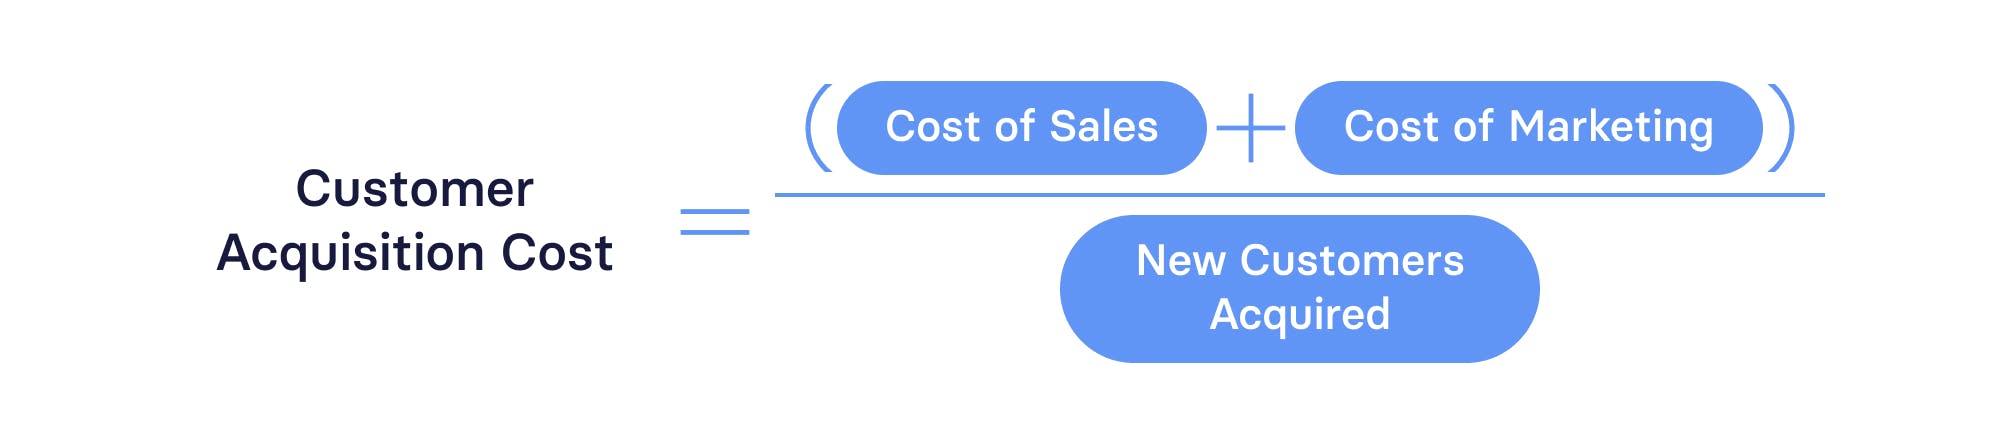
9. Customer Acquisition Costs
Customer acquisition cost may be the most important metric for the sales funnel, as it accounts for the sales funnel by comparing marketing and sales costs against the total number of new customers.
Your CAC allows you to keep an eye on overall marketing & sales efficiency and forecast how scalable sales and marketing efforts will be in the future. For those forecasts to be accurate, you must ensure that your CAC is fully burdened (salaries, campaign expenses, SEO spend, travel spend, executive wages, etc.) and that you align the sales cycle to your CAC calculation.
10. Monthly Recurring Revenue (MRR)
Monthly recurring revenue is a strong indicator of product/market fit and growth. While it’s a bottom-of-the-funnel metric, it continues to impact revenue forecasting and sets benchmarks for future lead generation and revenue growth goals by month and quarter.
To calculate MRR, divide your total contract value by total contract months.
If your company offers annual contracts, you can track annual recurring revenue (ARR) instead. But the insights around MRR allow marketing and sales to dive into more agile decision-making, which can help immediately optimize opportunities and improve the sales funnel by adjusting campaigns to attract the target audience or find ways to quicken the sales cycle.

Sales Funnel Metrics Benchmarks for SaaS Companies
While the categories and stages of the sales funnel provide a general overview of metrics to keep top of mind, there is plenty of nuance depending on your company’s growth stage and priorities.
There’s some value in looking at broader SaaS industry benchmarks for various sales funnel metrics. For example, Ray Rike (RevOps Squared) and Ben Murray (The SaaS CFO) highlight a few in their annual benchmarking report:
- Average sales cycle length ranges between 78 days and 360 days depending on your ACV
- CAC benchmarks have massive ranges, but the media CAC payback period is 19 months
- The median new CAC ratio is $1.56
But to gain a deeper understanding of your unique sales funnel, you need to benchmark against your own historical data.
Seeing trends in win rates, deal conversion rates, sales velocity, and stage-by-stage conversions will help you create assumptions for your top-line planning models. The more accurate your assumptions are, the easier it will be to gain strategic insight into your SaaS pricing strategy and go-to-market motion.
Track Sales Funnel Metrics in Real-Time with Mosaic
CRM and marketing automation software like HubSpot and Salesforce offer out-of-the-box reports for basic sales funnel metrics. But those reports are limited to point-in-time views, lacking the kind of trended insights that finance needs to support sales and marketing.
Evaluating your company’s sales funnel metrics allows for more immediate actions and insights. Mosaic makes collecting accurate data easier as it integrates with your CRM and HRIS systems to help ensure metrics are fully burdened with all the information you need.
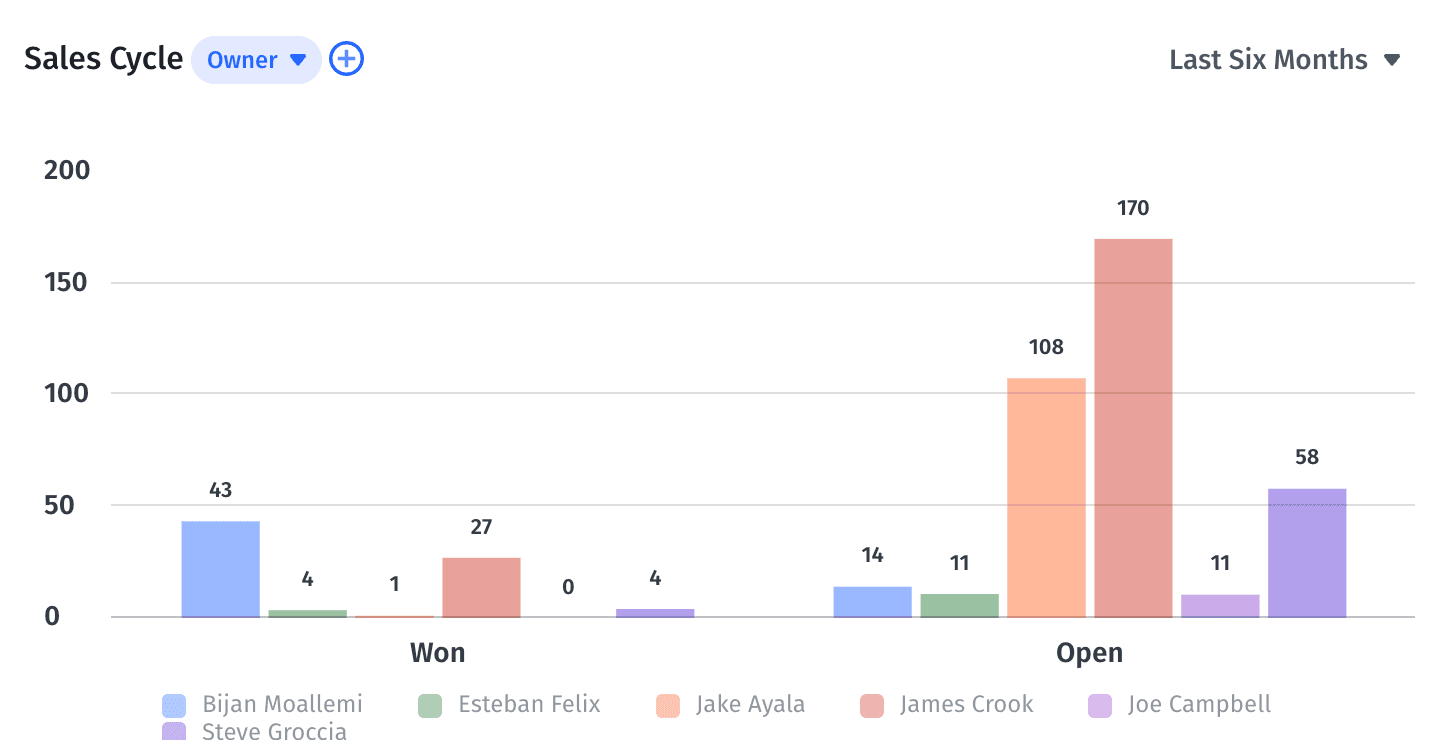
Sales cycle dashboard in Mosaic (get a demo to see it in action)
Mosaic offers automation that not only calculates metrics quickly but provides real-time updates that immediately appear in a pre-loaded sales pipeline template. And with a few clicks, you can customize templates and sales dashboards to keep an eye on the metrics that matter most and dive deeper into the data.
Ready to take the entire sales funnel to the next level? Request a personalized demo today, and see how Mosaic encourages stronger, more actionable decision-making and collaboration.
Track Sales Metrics in Granular Detail

Sales Funnel Metric FAQs
What are the stages of the sales funnel?
There are six stages in the standard sales funnel that can be categorized into top of funnel (TOFU), middle of funnel (MOFU), and bottom of funnel (BOFU). The top of funnel stages are awareness and interest, the middle of funnel stages are consideration and intent, and the bottom of funnel stages are evaluation and purchase.
How do you analyze a sales funnel?
What is a good funnel conversion rate in SaaS?
Explore Related Metrics


Own the of your business.
