Accounts Payable (AP) Turnover Ratio
What Is AP Turnover Ratio?
The accounts payable turnover ratio, or AP turnover, shows the rate at which a business pays its creditors during a specified accounting period. This KPI can indicate a company’s ability to manage cash flow well and then pay off its accounts in a timely manner. AP turnover typically measures short-term liquidity and financial obligations, but when viewed over a longer period of time it can give valuable insight into the financial condition of the business.

Categories
Table of Contents
AP Turnover Ratio Formula & Calculator Tool
Calculate the accounts payable turnover ratio formula by taking the total net credit purchases during a specific period and dividing that by the average accounts payable for that period. The average accounts payable is found by adding the beginning and ending accounts payable balances for that period of time and dividing it by two.
Here’s what the accounts payable turnover ratio formula looks like:

AP Turnover Calculator
Your AP Turnover Is
0 x
Accounts Payable Turnover Ratio Example
To demonstrate the turnover ratio formula, imagine a company’s total net credit purchases amounted to $400,000 for a certain period. If their average accounts payable during that same period was $175,000, their AP turnover ratio is 2.29.
$400,000/ $175,000 = 2.29
That means the company has paid its average AP balance 2.29 times during the period of time measured. But is that a good ratio or a bad ratio? That all depends on the amount of time measured, along with current AP turnover ratio benchmarks and trends over time in the SaaS industry.
To get the most information out of your AP turnover ratio, complete a full financial analysis. You’ll see how your AP turnover ratio impacts other metrics in the business, and vice versa, giving you a clear picture of the business’s financial condition.
What Your AP Turnover Ratio Means
The AP turnover ratio provides important strategic insights about the liquidity of a business in the short term, as well as a company’s ability to efficiently manage its cash flow. So, are higher or lower accounts payable turnover ratios better? That depends.
What a Low AP Turnover Ratio Means
A low AP turnover ratio could indicate that a company is in financial distress or having difficulty paying off accounts. But, it could also indicate that a business is making strategic financial decisions about upfront investments that will pay off later.
What a High AP Turnover Ratio Means
A high turnover ratio indicates that a business is paying off accounts quickly, which is often what lenders and suppliers are looking for.
The AP turnover ratio is unique in that businesses want to show they can pay their bills on time, but they also want to show they can use their investments wisely. Investors and lenders keep a close eye on liquidity, debt, and net burn because they want to track the company’s financial efficiency. But, if a business pays off accounts too quickly, it may not be using the opportunity to invest that credit elsewhere and make greater gains. Finding the right balance between a high and low accounts payable turnover ratio is ideal for the business.
How Can SaaS Companies Find the Right Balance?
Finding the right balance between high and low accounts payable turnover ratios is important for a financially stable business that invests in growth opportunities. A higher ratio satisfies lenders and creditors and highlights your creditworthiness, which is critical if your business is dependent on lines of credit to operate. But, investors may also seek evidence that the company knows how to use investments strategically. In that case, a business may take longer to pay off bills while it uses funds to benefit the business.
SaaS companies can find the right balance by tracking their accounts payable turnover ratio carefully with effective financial reporting. Analyzing the following SaaS finance metrics and financial statements will help you convey the financial and operational help of your business so partners can be proactive about necessary changes.
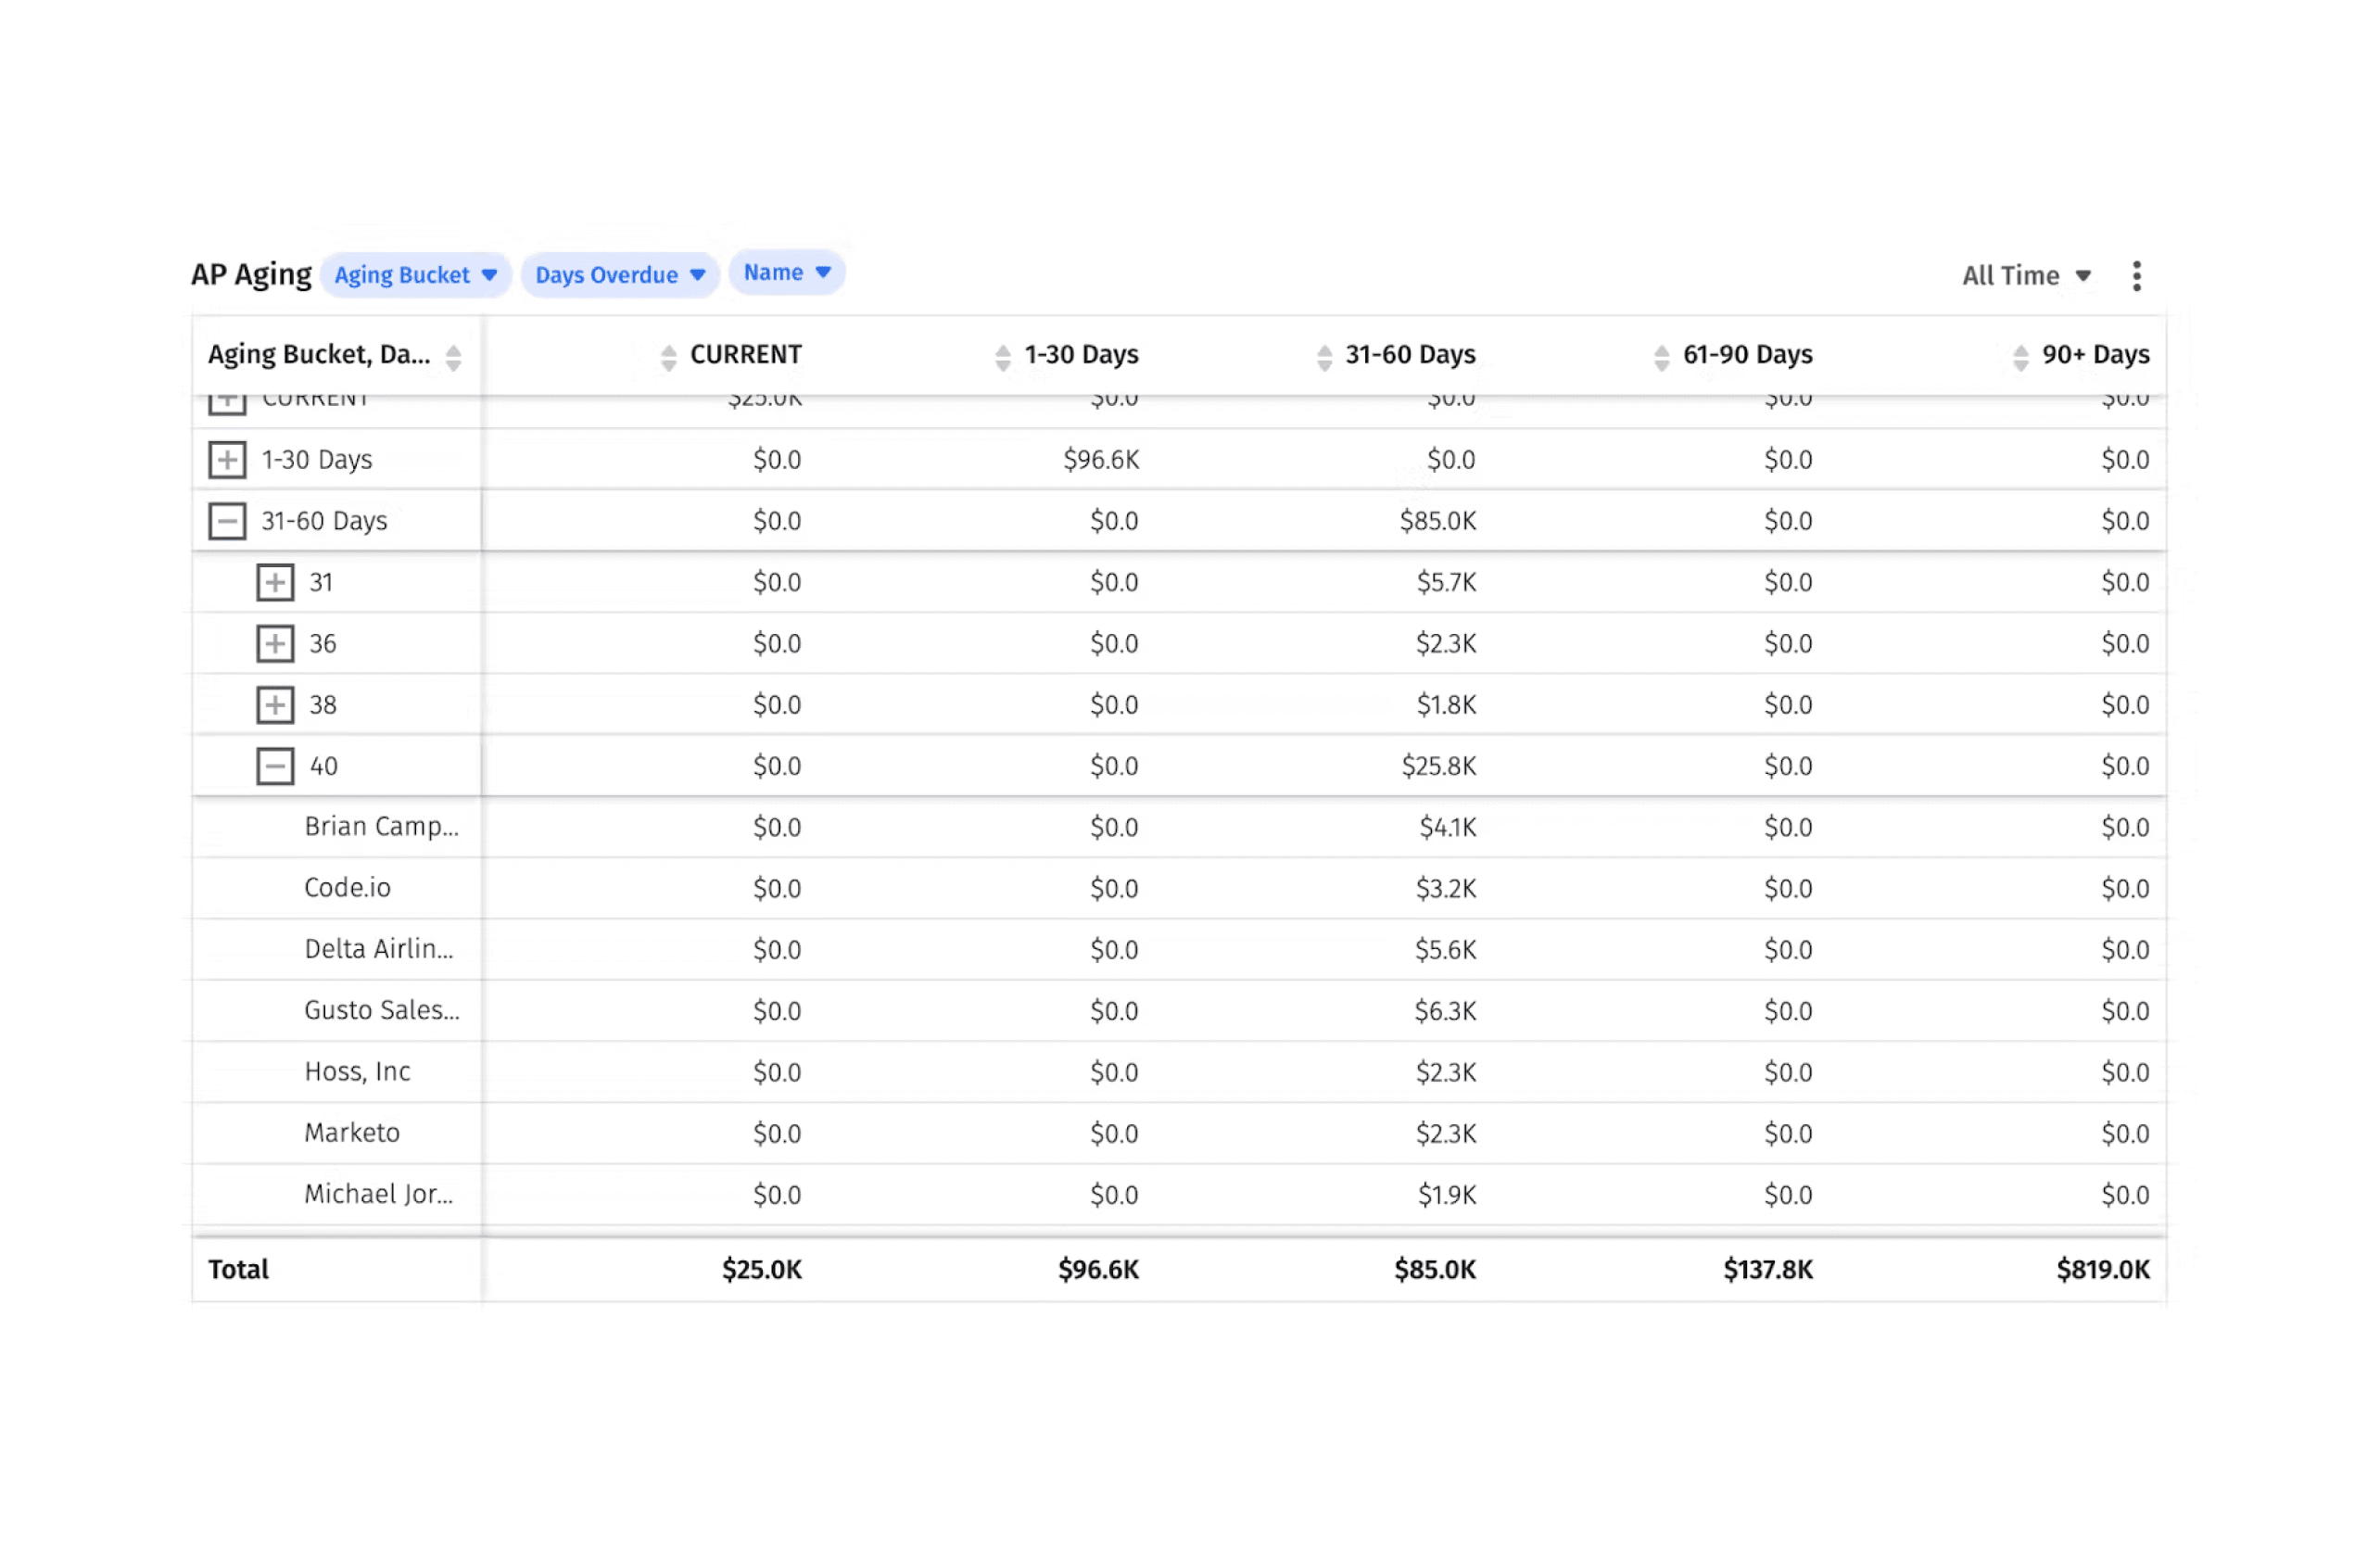
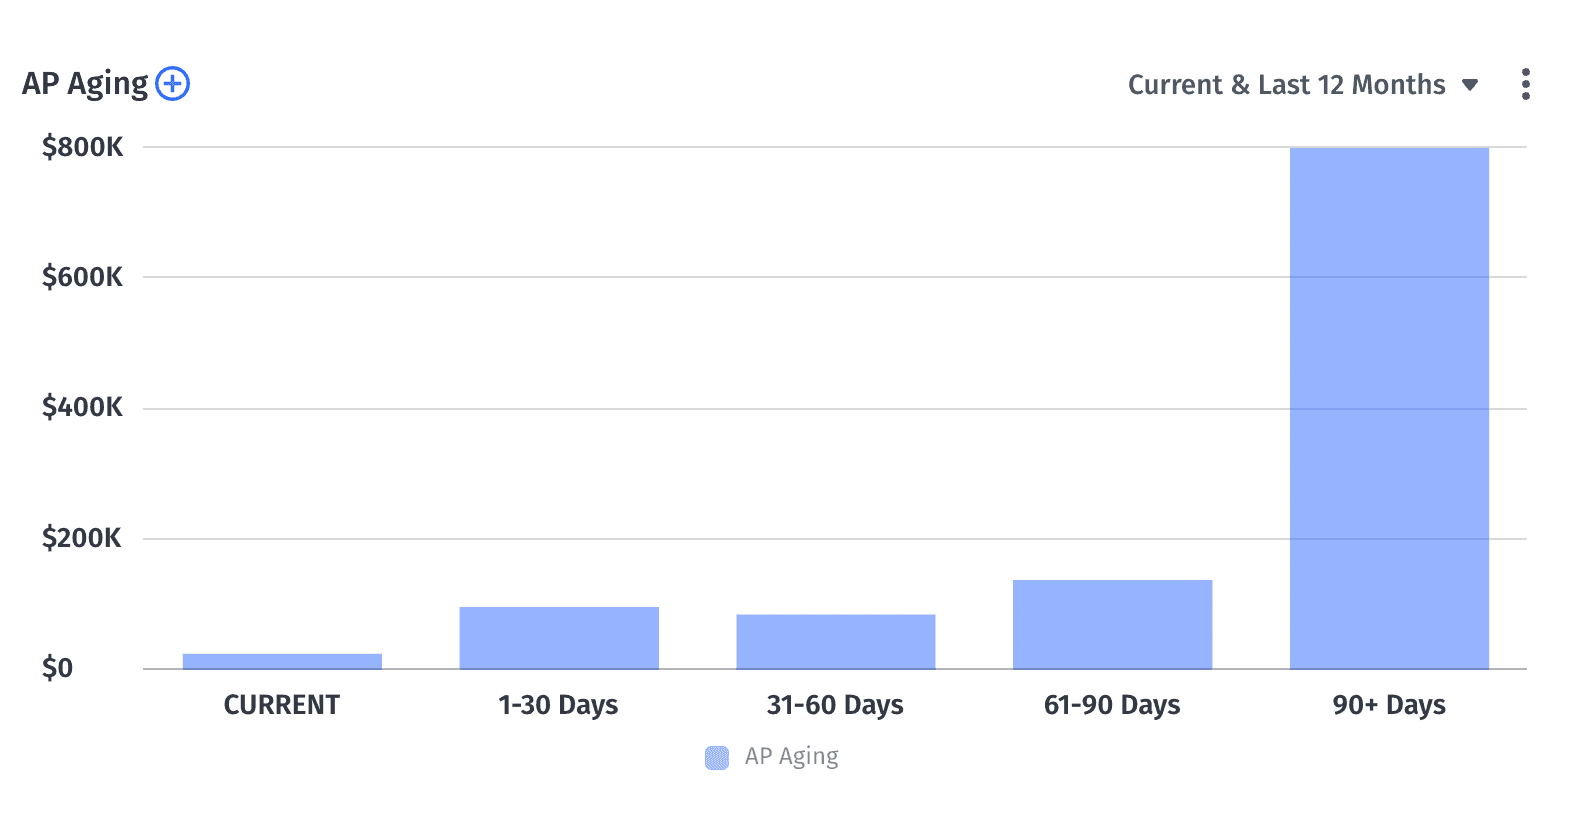
- AP aging report: The AP aging report checks all accounts payable against your balance sheet to provide insight into how any overdue account debt may impact future quarters. Since the AP aging report allows the business to keep track of upcoming due payments, it can help the business resolve debt as quickly as possible, increasing AP turnover.
- Net burn: The rate at which the business uses up money. If a company’s net burn is high, but its AP turnover ratio is low, there are significant cash flow issues to resolve.
- Capital efficiency: Measures how much money is put into the business and how much revenue the business generates from that money. There are several capital efficiency metrics that could prove helpful, including burn multiple, net working capital, cash conversion score, or return on capital efficiency.
- Balance sheet: A snapshot of the company’s net worth at a particular point in time. Because it details both assets (like beginning and end payable balances for accounts receivable) and current liabilities (like outstanding accounts payable and short-term debts), it shows you exactly where the companies’ finances stand at that point in time.
- Cash flow statement: This KPI shows how well the business is able to generate cash to pay off debt and expenses, offering strategic insight into how cash moves in and out of the company. An effective cash flow analysis helps you track free cash flow and identify opportunities to reinvest.
Track & Analyze AP Turnover and Other AP Metrics in Real-Time

Why You Should Track AP Turnover
A company’s investors and creditors will pay attention to accounts payable turnover because it shows how often the business pays off debt. This gives a clear view of how well the company is managing its money. If the company’s AP turnover is too infrequent, creditors may opt not to extend credit to the business.
AP aging comes into play here, too, since it digs deeper into accounts payable and how any outstanding debt could affect future financials. An AP aging report allows you to organize the total amount due into 30-day “buckets”, so you can track payments that are due and payments that are overdue. If your AP turnover isn’t high enough, you’ll see how that lower ratio affects your ongoing debt. Startups are particularly reliant on AP aging reports for startup cash flow forecasting and runway planning.
How to Improve Your AP Turnover Ratio
Keep track of whether the accounts payable turnover ratio is increasing or decreasing over time for valuable insight into how the business is doing financially.
To improve your AP turnover ratio, it’s important to know where your current ratio falls within SaaS benchmarks. From there, use the following tips to collaborate with other departments to help improve financial ratios as needed.
How To Increase Your AP Turnover Ratio
If you have a low ratio, you’re taking too long to pay off debt. Increase your ratio by:
- Evaluate cash flow: Perform a cash flow analysis to identify areas of improvement for cash inflow and outflow. Flag areas where costs could be cut, along with areas where revenue could increase.
- Assess your AR Turnover Ratio: Review your accounts receivable turnover ratio and look for delays in payments to the company. Settle any unpaid invoices. Partner with sales to discuss increasing sales revenue and sales turnover rate so the company gets paid faster and more often.
- Use AP automation to keep your bill payment on a tight schedule.
- Update your credit terms: Talk to your creditors to see if you can improve your payment schedule or improve the payment terms of your agreement so you can pay debt faster. Find out if any creditors allow you to take advantage of early payment discounts as part of their favorable credit terms.
How To Decrease Your AP Turnover Ratio
A higher AP turnover rate is generally preferable, but a ratio that’s unusually high may signal that the company isn’t using cash flow to its full advantage. Decrease your ratio by:
- Don’t pay bills early: Use the full time allotted to pay off debt rather than paying early so the business can use funds to grow. Partner with business leaders to see how those funds can be used most effectively.
- Lengthen payment schedules: If you’ve reliably paid off debts on time, creditors may give you longer payment terms to pay off debt. This gives the company more time to use funds to reinvest in the business.
Monitor AP Turnover in Real Time with Mosaic
Tracking and analyzing your AP turnover is an important part of evaluating the company’s financial condition. You probably have AP software that tracks your accounts payable. It may even provide a turnover metric for you. But it’s important to look beyond the numbers to the “why” behind them. If your AP turnover is too low or too high, you need a ratio analysis to identify what’s causing your AP turnover ratio to fall outside typical SaaS benchmarks. You also need quick access to your most important metrics without taking valuable time entering them manually into Excel from different source systems and financial statements.
Mosaic integrates with your ERP to gather all the data needed to monitor your AP turnover in real time. With over 150 out-of-the-box metrics and prebuilt dashboards, Mosaic allows you to get real-time access to the metrics that matter. Look quickly at metrics like your AP aging report, balance sheet, or net burn to get vital information about how the business spends money. Review billings and collections dashboards side-by-side to get better insights into cash inflow and outflow to improve efficiency.

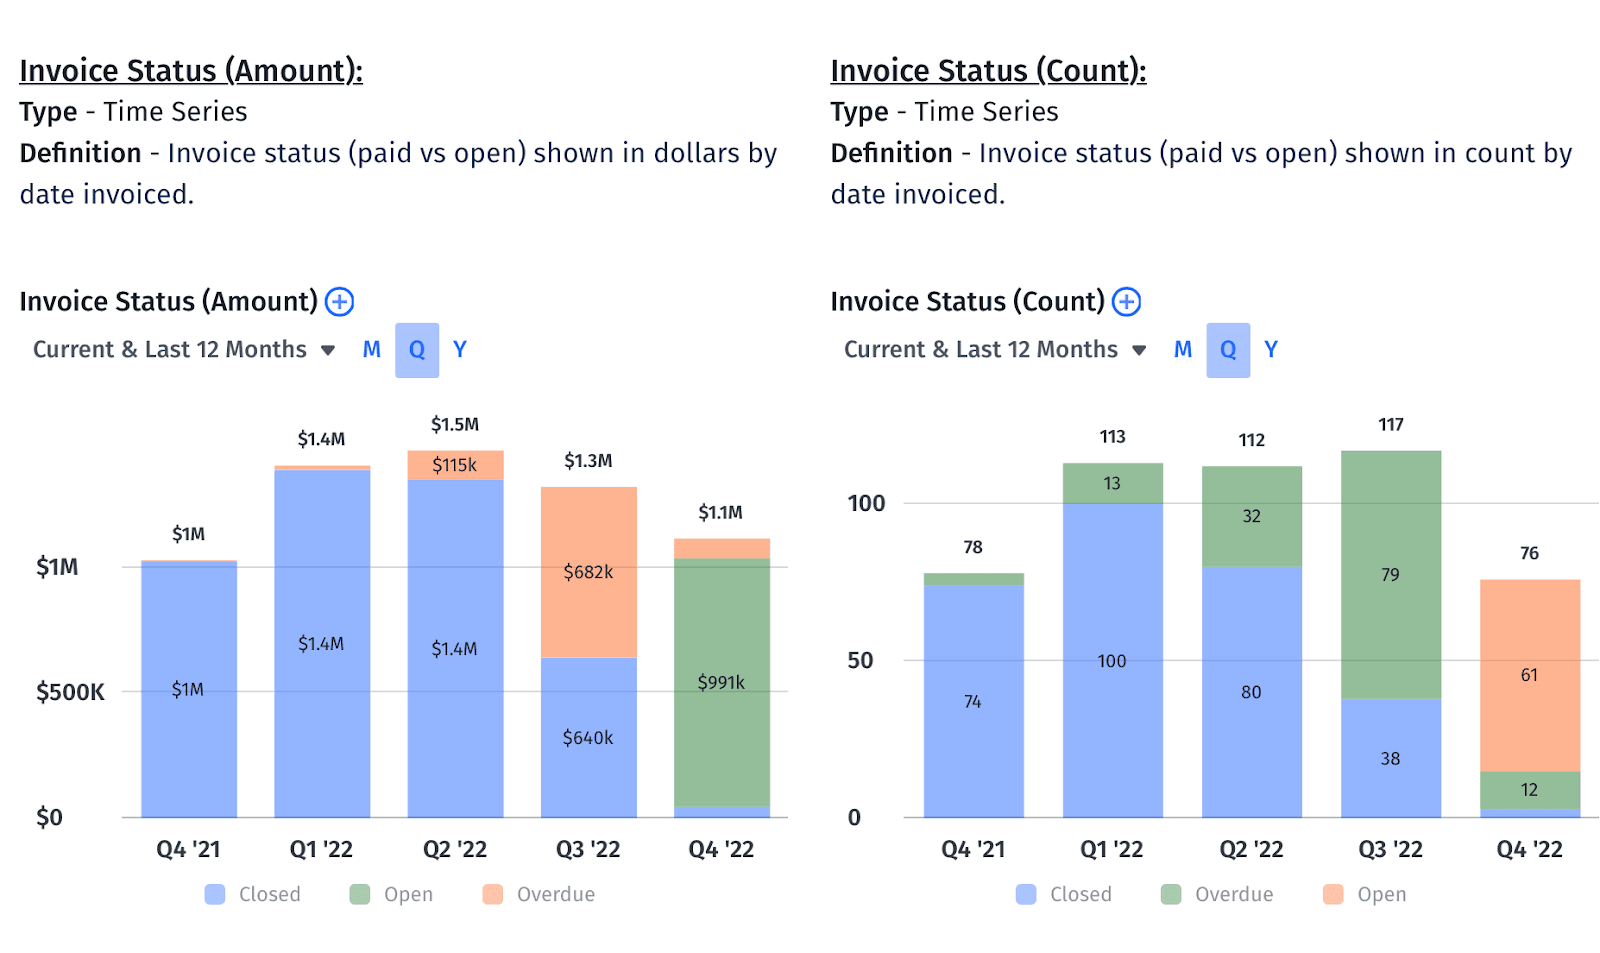
Mosaic also offers customizable templates to create unique dashboards that include the metrics you need to track most. Track invoice status metrics — both amount and count — to keep track of the revenue coming in. Monitor expenses as a percentage of revenue to ensure you’re not overspending in any one area. And use Mosaic’s income statement dashboard to proactively monitor your AP turnover by summarizing your revenue and expenses during a certain period of time. You’ll see whether the business generates enough revenue to pay off debt in a timely manner.

With this data at your fingertips, cross-departmental collaboration becomes more productive, allowing you to identify opportunities to improve efficiency and AP turnover to help the business grow.
Getting the data you need is important, but accessing it quickly ensures you can spend your time analyzing the metrics and developing proactive strategies to move the business forward. This comprehensive financial analysis gets to the heart of proactive decision-making so you’re always looking forward and incorporating agile planning to help the business succeed. Request a personalized demo today to find out how to take your analytics to the next level with our financial dashboards and improve efficiency and profitability for the company.
AP Turnover Ratio FAQs
How do you calculate AP turnover in days?
Calculating the AP turnover in days, also known as days payable outstanding (DPO), shows you the average number of days an account remains unpaid. The formula for calculating the AP turnover in days is to divide 365 days by the AP turnover ratio.
AP turnover in days = 365/ AP turnover ratio
What is a good payable turnover ratio?
What is the difference between AP turnover and AR turnover?
Explore Related Metrics
Own the of your business.


