Accounts Receivable KPIs: 7 Crucial Metrics To Track

Joe Michalowski
Director of Content

For high-growth companies, top-line growth is what earns all the headlines. You see stories touting the massive ARR growth of a company and assume it’s a success — but every top-line growth success story has to be backed up by effective accounts receivable management.
Without a tight grip on your accounts receivable, you risk experiencing cash flow issues that leave you light on working capital to keep the business growing.
Accounts receivable KPIs (key performance indicators) can provide a quick overview and insights into how well you’re managing your cash collections.
Read on to learn about 7 accounts receivable KPIs you can track to improve your business’s financial efficiency.
Table of Contents
What Are Accounts Receivable KPIs?
Accounts receivable KPIs are performance metrics that give insight into how efficiently your business collects and manages cash. Put simply, account receivable KPIs provide a snapshot of how efficiently you’re collecting cash owed to you, which can have important implications for company liquidity and cash flow
7 Most Important Accounts Receivable KPIs to Track
The specific AR KPIs you should be tracking will depend on your business model and maturity.
But at almost every stage of growth, the following 7 AR metrics will prove valuable both for maintaining clean accounting records and uncovering strategic insights about your business.
1. Days Sales Outstanding (DSO)
Days Sales Outstanding (DSO) is an accounts receivable metric that tells you the average number of days it takes your customers to pay you.
You can calculate DSO by using the following formula:
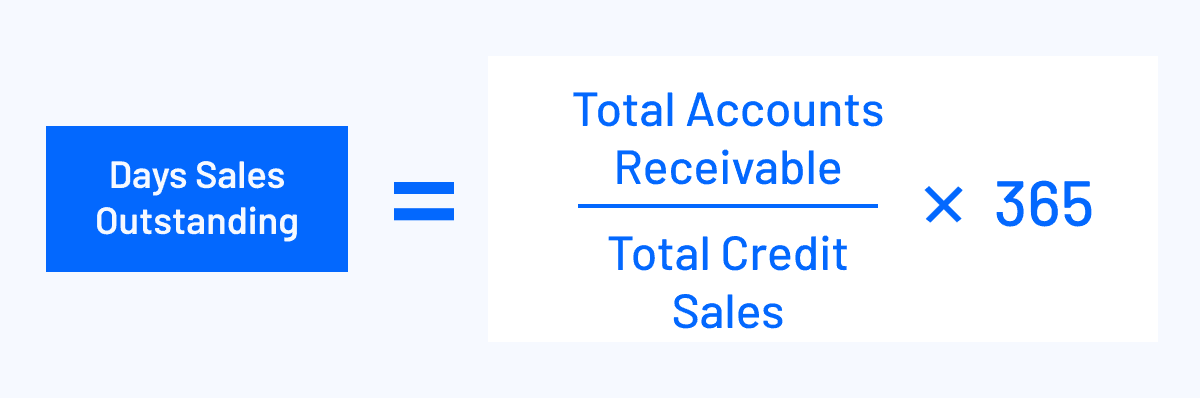
The lower your DSO, the better since you’ll bring in cash faster.
A high DSO means a lot of your money is tied into accounts receivable. Lowering the DSO can help you free up cash to invest elsewhere, such as inventory or other current assets.
The AR team should speed up collections to reach a low DSO. You can also offer a discount to encourage quick payments.
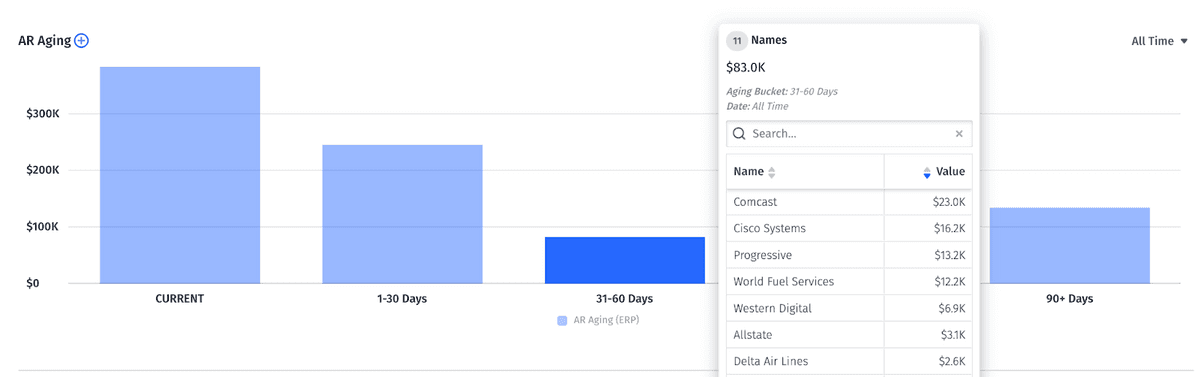
An AR aging report is one way to monitor DSO in real-time. These reports bucket invoices with due dates that have passed into time periods so you can drill down into specific areas of collections inefficiencies.
2. Best Possible Days Sales Outstanding
Best Possible DSO tells you the average number of days it takes your customers to pay, under the assumption that your customers always pay on time.
When calculating the Best Possible DSO, consider only the current accounts receivables (exclude the overdue account receivables).
The formula to calculate Best Possible DSO is: [Current Accounts Receivable / Total Credit Sales] x 365
3. Accounts Receivable Turnover Ratio
Your accounts receivable turnover ratio tells you the number of times you collect your average accounts receivable balance per year.
Here’s how you can calculate AR turnover ratio:
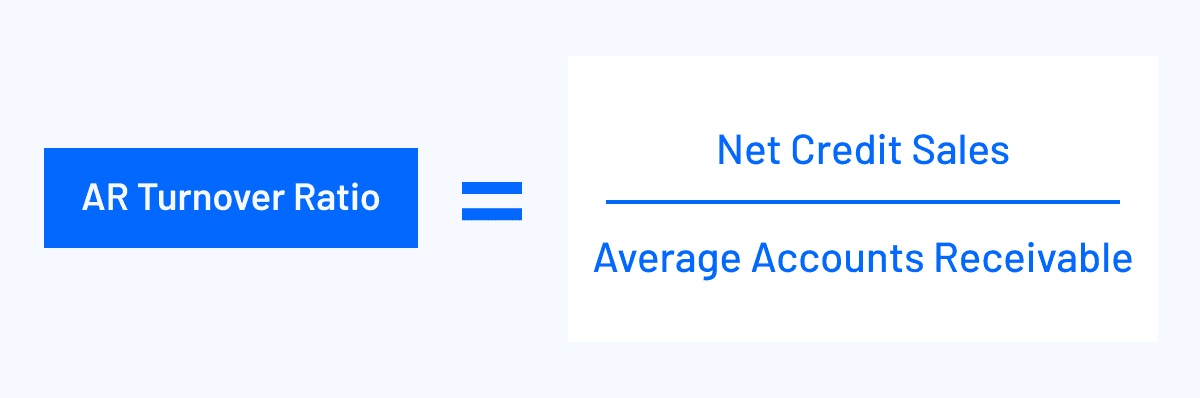
The greater the ART, the better your cash flow. If your ART is low, ramp up your collections process or tighten your credit policy.
4. Average Days Delinquent (ADD)
Average days delinquent is an accounts receivable metric that lets you know how many days your receivables remain overdue on average.
Ideally, your ADD should be zero: no overdue accounts. But that rarely happens. You usually have at least some overdue accounts, which will reflect in your ADD.
Here is how you can calculate ADD:

5. Bad Debts to Sales
Bad debts to sales is a key metric for understanding the occurrence of bad debts. Bad debt is an account receivable you don’t expect to collect. The bad debts to sales shows you the percentage of your revenue that turns into bad debts.
Here’s you can calculate bad debts to sales:

While bad debt is a part of business and the net benefits often outweigh the losses, ensure your bad debts to sales ratio stays below 15%. If it’s higher than that, your account receivable system requires improvement.
6. Collections Effectiveness Index
As the name suggests, collections effectiveness index (CEI) measures the efficiency of your AR team in collecting receivables.
You can use the following formula to calculate the CEI:
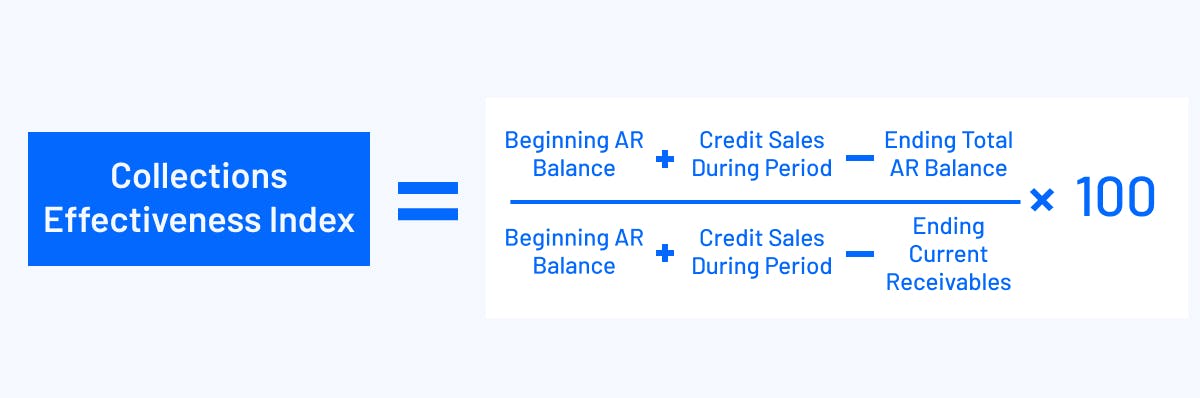
A higher CEI represents better collections performance, so you want to maximize your CEI. You can do so via:
- Ensuring error-free invoicing
- Proper communication with debtors
- Consistent follow-ups
7. Operational Cost Per Collection
Using operational cost per collection, you can monitor how much you’re spending on collecting accounts receivables.
The operational cost of collections includes money spent on all collections management activities, such as the cost of accounts receivable software and communication channels.
The lower the operational cost, the higher the bottom line. Also, the more accounts receivables you have, the higher your operational cost. So you need to look at the operational cost per collection, not just the total operational cost of collection.
You can do that by dividing the fully-burdened cost of your collections efforts by the total collections for a given period.

The Importance of Accounts Receivable KPIs
Tracking accounts receivable KPIs and other sales performance metrics offers several benefits. They help you:

Manage Cash Flow
Optimizing your accounts receivable KPIs helps you manage your cash flows. For instance, keeping your DSO low reduces the cash tied up in accounts receivable.

Maintain Adequate Working Capital
Tracking accounts receivable KPIs helps you avoid an oversized accounts receivable balance.

Minimize Bad Debts
The likeliness of a debtor paying decreases with AR aging. Understanding your ADD helps you minimize the bad debts.

Make Credit Policy Decisions
Longer credit periods help improve sales performance metrics and customer retention metrics, but they also come with a higher chance of bad debts as well as opportunity costs to the business. The bad debts to sales ratio helps determine where to draw the line — where the benefits still outweigh the costs, so you aren’t extending credit periods any longer than necessary.

Gauge Accounts Receivable Performance
Your AR team manages the accounts receivables. So any positive or negative AR metrics reflect the performance and efficiency of your AR team.
Simplify Accounts Receivable KPI Tracking With Mosaic Dashboards
Unless you have a full-fledged collections team, managing all of these metrics manually in an Excel spreadsheet can be time-consuming. This is where the functionality of financial platforms like Mosaic comes into play. Automating financial data collection and aggregation makes it easier for finance and accounting teams to focus more on the strategic side of their jobs. And even if you have that dedicated team, the lack of real-time insight and the error-prone nature of spreadsheets limit the strategic value you can get from AR metrics.
This is one area where CFOs and their teams can benefit greatly from automation. Automating financial data collection and aggregation makes it easier for finance and accounting teams to focus more on the strategic side of their jobs — finding the “why“ behind the numbers and surfacing insights to the company at large.
Mosaic simplifies accounts receivable KPI tracking with pre-built dashboard templates and provides drill-down analysis capabilities that empower finance and accounting teams to be more strategic.
If the pre-built billings and collections template doesn’t meet your accounts receivable dashboard needs, you can build your own Analysis Canvas with the AR KPIs that matter most to your business.
Request a personalized demo today to learn more about how Mosaic can take your financial dashboards to the next level, empower your team to improve accounts receivable performance, and help you become a more strategic partner in your business.
How Strategic Finance Software Can Help Finance Teams

Accounts Receivable KPI and Metrics FAQs
What is the main goal for accounts receivable teams?
Accounts receivable departments aim to efficiently collect customer payments and manage outstanding invoices. When these objectives are met, AR teams help secure a consistent cash flow for a business and ensure that top-line revenue leads to bottom-line growth.
What are ways to measure accounts receivable performance?
How can you improve AR collection?
What are some common challenges businesses face when tracking accounts receivable KPIs?
What are some best practices for tracking accounts receivable KPIs?


Own the of your business.
