

Cash flow is the amount of money a business has brought in and spent over a specific period. Ideally, every business wants to have positive cash flow (or make more than they spend) so they have plenty of working capital. Otherwise, you can deplete any cash reserves, go into debt, or have to seek outside funding.
The U.S. Chamber of Commerce showed cash flow problems are the top reason that companies fail. But with enough cash, your company likely has enough money to invest in growth and pay dividends to shareholders without taking on large amounts of debt.
To ensure your cash flow doesn’t suddenly slow to a trickle, you’ll need more than a high-level overview of your income and spending. Instead, you need deeper insights and thorough breakdowns of your cash inflows and outflows. That way, it’s easier to spot trends, streamline cash flow management, and map out strategic growth plans.
Digging deeper into your cash flow is far easier when you’re monitoring the right metrics (and employing the right tools to do so).
Table of Contents
7 Essential Cash Flow Metrics to Track
It’s easier to keep track of your cash flow when you know what key performance indicators (KPIs) to monitor. Following the metrics that matter means you can accurately record and analyze your company’s financial performance.
Although you can manually calculate all these metrics, you can skip the formulas altogether with Mosaic. With the platform’s plug-and-play financial dashboards, you can monitor all your cash flow metrics in real time — so it’s easier to go from data to insights faster.
1. Operating Cash Flow
The top cash flow KPI to watch is your cash flow from operating activities, which is why it’s usually found right at the top of your cash flow statement. Also known as your operating cash flow (OCF), this cash flow and operational metric is how money moves in and out of your company.
When a business has strong cash flow from operations, it can support its own activities without the need for any outside loans or investments.
Operating cash flow includes net income from sales, income taxes, accounts payable, accounts receivable, and any equipment or property depreciation. However, OCF doesn’t encompass revenue from interest or any investments.
You can calculate operating cash flow in two ways: the direct and indirect methods.
Direct:

For example: ABC Co. brought in $10 million in total revenue last year and recorded expenses of $7 million. That means the company’s operating cash flow would be $3 million.
The direct method makes it easier to hone in on your actual amount of cash available. And although this formula is the simplest of the two, it can be a time-consuming task to track individual cash transactions.
Indirect:

Yes, this formula is far more complicated. But since cash takes time to move around, following the indirect method offers a more accurate period of where your OCF stands at that moment.
Mosaic makes understanding your operating cash flow much easier with our out of the box metric called Net burn.
With a simple configuration of excluding certain accounts from your GL, Mosaic automatically calculates your company’s cash flow from operations allowing you to see where every single dollar is coming and going. You can view this on a weekly basis with deep granularity.
2. Burn Rate
Burn rate is a metric startups most often lean on. This is a formula that calculates how quickly your company is using up (or “burning” through) cash.
Typically, a burn rate is measured in months and falls into one of two categories:
1). Net burn, or your total monthly cash loss
2). Gross burn, which is your monthly cash outflow
For example, if you have $20,000 in monthly expenses and bring in $10,000 in monthly revenue, your net burn rate is $10,000. That means you’re losing $10,000 a month, which will impact your cash runway (see below).
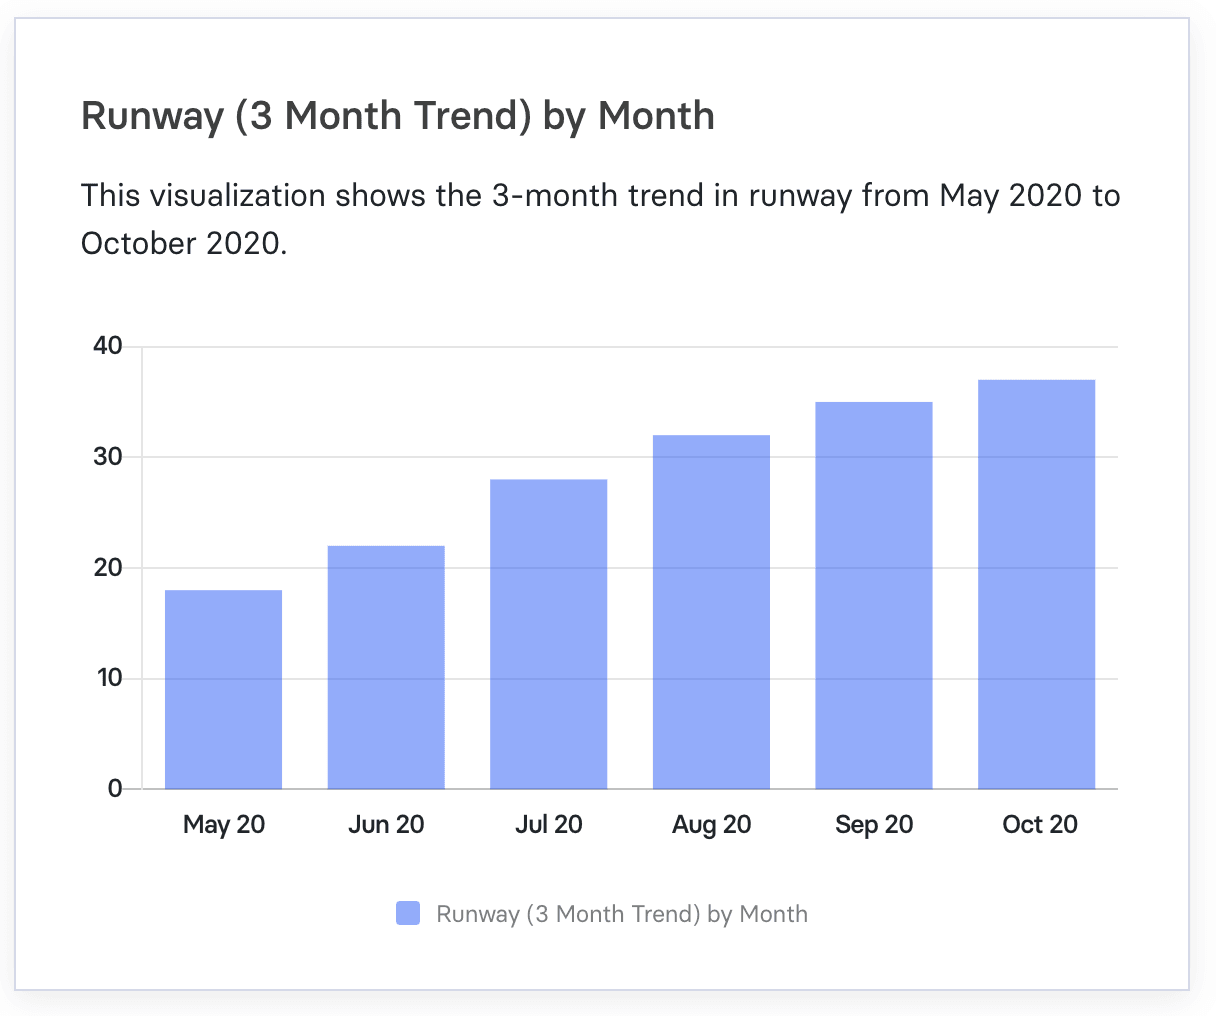
3. Cash Runway
Cash runway is the time in months a company has before depleting all its cash. So, for example, if your business has a six-month runway, you have half a year before your cash balance hits $0.
To calculate your runway, you can use this simple formula:

For example, your software startup has $2 million cash on hand with a net burn rate of $50,000 a month. Your runway would amount to 40 months.
It’s important to keep an eye on this metric, particularly if you’re a startup. Because many startups sacrifice profit for growth early on, they need more cash reserves on hand. Some experts recommend that early stage startups have a 12-18 month runway to have enough time to meet their goals and secure new funding sources.
But a Florida International University study showed funding rounds take an average of 18-22 months. With this in mind, startups may want to keep 18+ months of cash runway in the bank to give them breathing room between funding rounds.
4. Days Payable Outstanding
Days payable outstanding (DPO) measures the average number of days a company needs to settle its bills. This is an important cash flow metric since it’s a strong indicator of how well a company manages its accounts payable.
The formula to calculate DPO (known as the classic method) looks like this:

Let’s dive into what this might look like in the real world. Our friends at software company ABC Co. are reviewing their DPO for Q1 2024 (the first 90 days of the year). In Q1, accounts payable to service providers was $120,000. The cost of goods sold (COGS), which included server rentals, licensing fees, and customer support, added up to $200,000.
So, your DPO calculation would look like this:
DPO = ($120,000 / $200,000) x 90 days = 54 days
So, ABC Co. takes 54 days to settle outstanding bills and invoices.
Using a tool like Mosaic makes it easy to track DPO along with other accounts payable metrics, including AP Aging and AP Turnover, so you can better understand exactly what’s going on with your AP processes and make adjustments as needed.
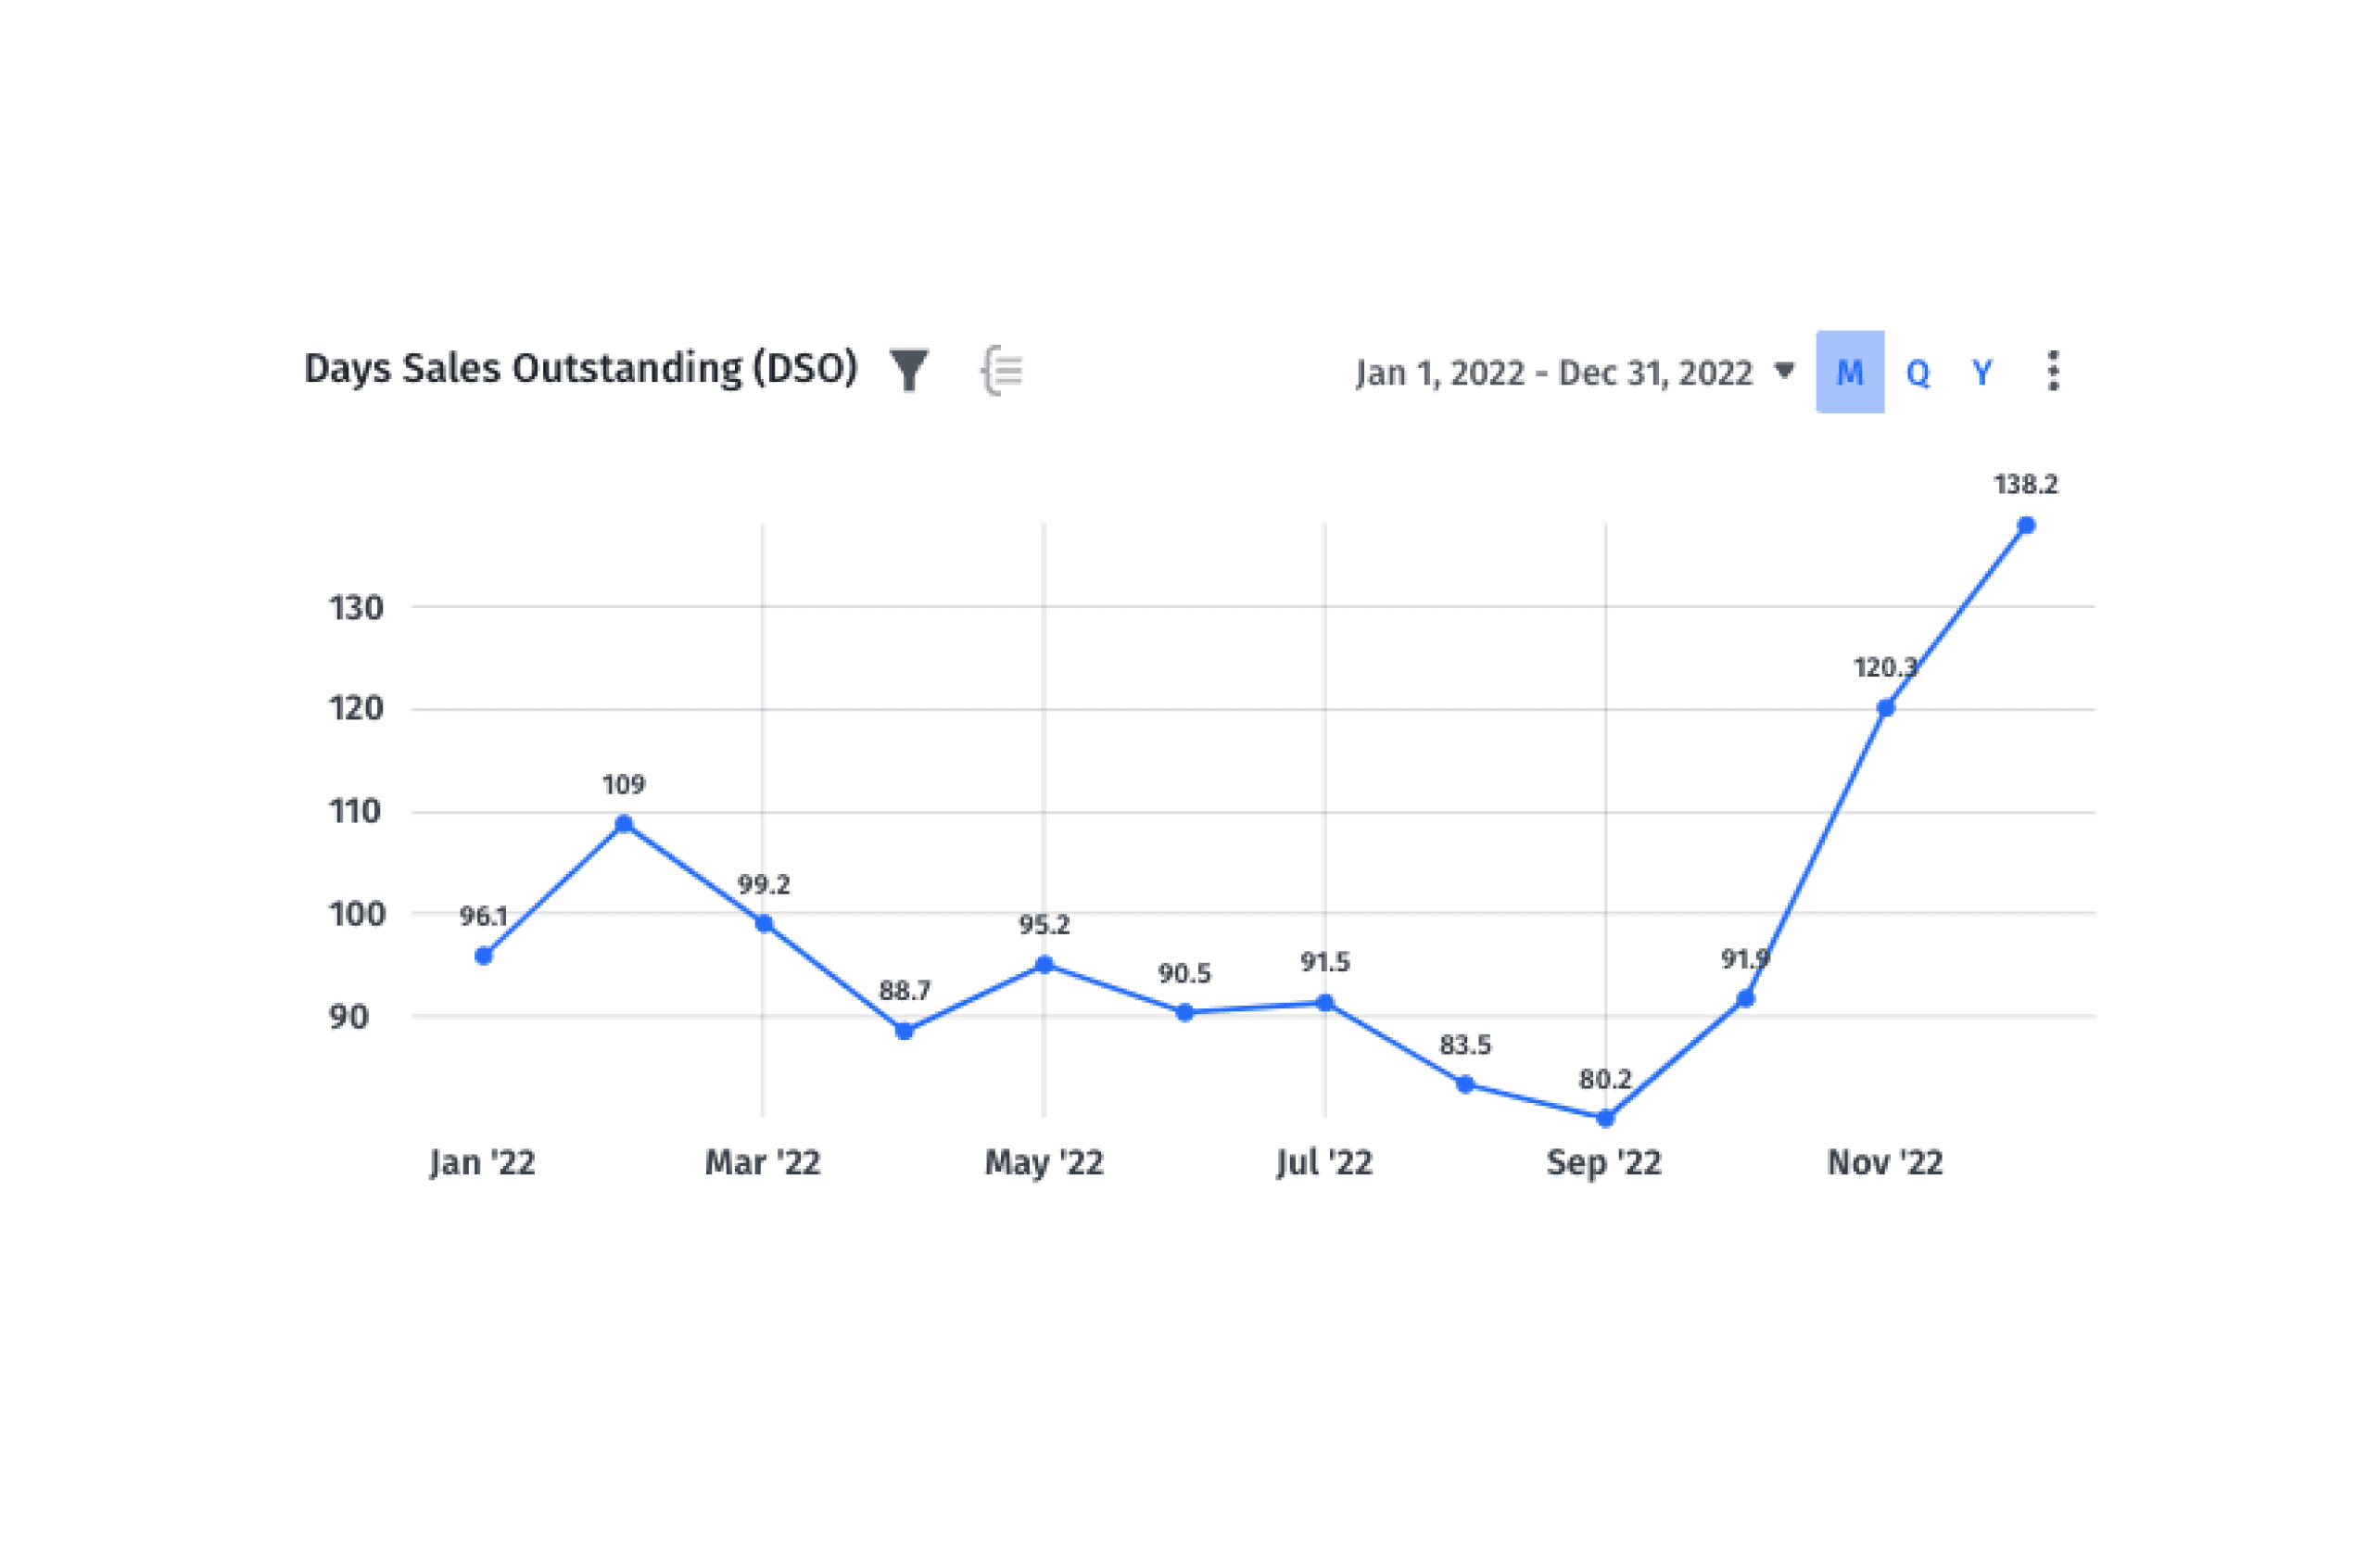
5. Days Sales Outstanding
Once your company makes a sale, how long does it take you to collect the corresponding payment? That’s what days sales outstanding (DSO) measures — the average time your company takes to get payments after a sale.
To calculate DSO, use this formula:

When you pair DSO and DPO, you get a view of how quickly you’re paid and how quickly you pay your bills. This offers a comprehensive insight into the health of your company’s cash flow.
6. Cash Inflows and Outflows
Cash inflows and outflows sum up how money is flowing in and out of the business. As the name suggests, inflow is cash coming into a company, like net income from selling products/services, inventory, and accounts receivable. On the other hand, outflow is any cash you spend on the day-to-day costs of running the business, like rent, sales, marketing, income tax, wages, and so on.
Monitoring both inflows and outflows provides a solid overview of cash flow trends. Keeping an eye on these metrics allows you to optimize your limited resources and make strategic decisions based.
Typically, companies will use cash flow statements to track their inflow and outflow. In this report, cash flow is divided into three sections based on the type of business activity:
- Operating cash flow
- Investing cash flow (money from your business’s investments)
- Financing cash flow (cash from financing activities like funding rounds, loans, stock sales, dividends, and long-term debt payments)
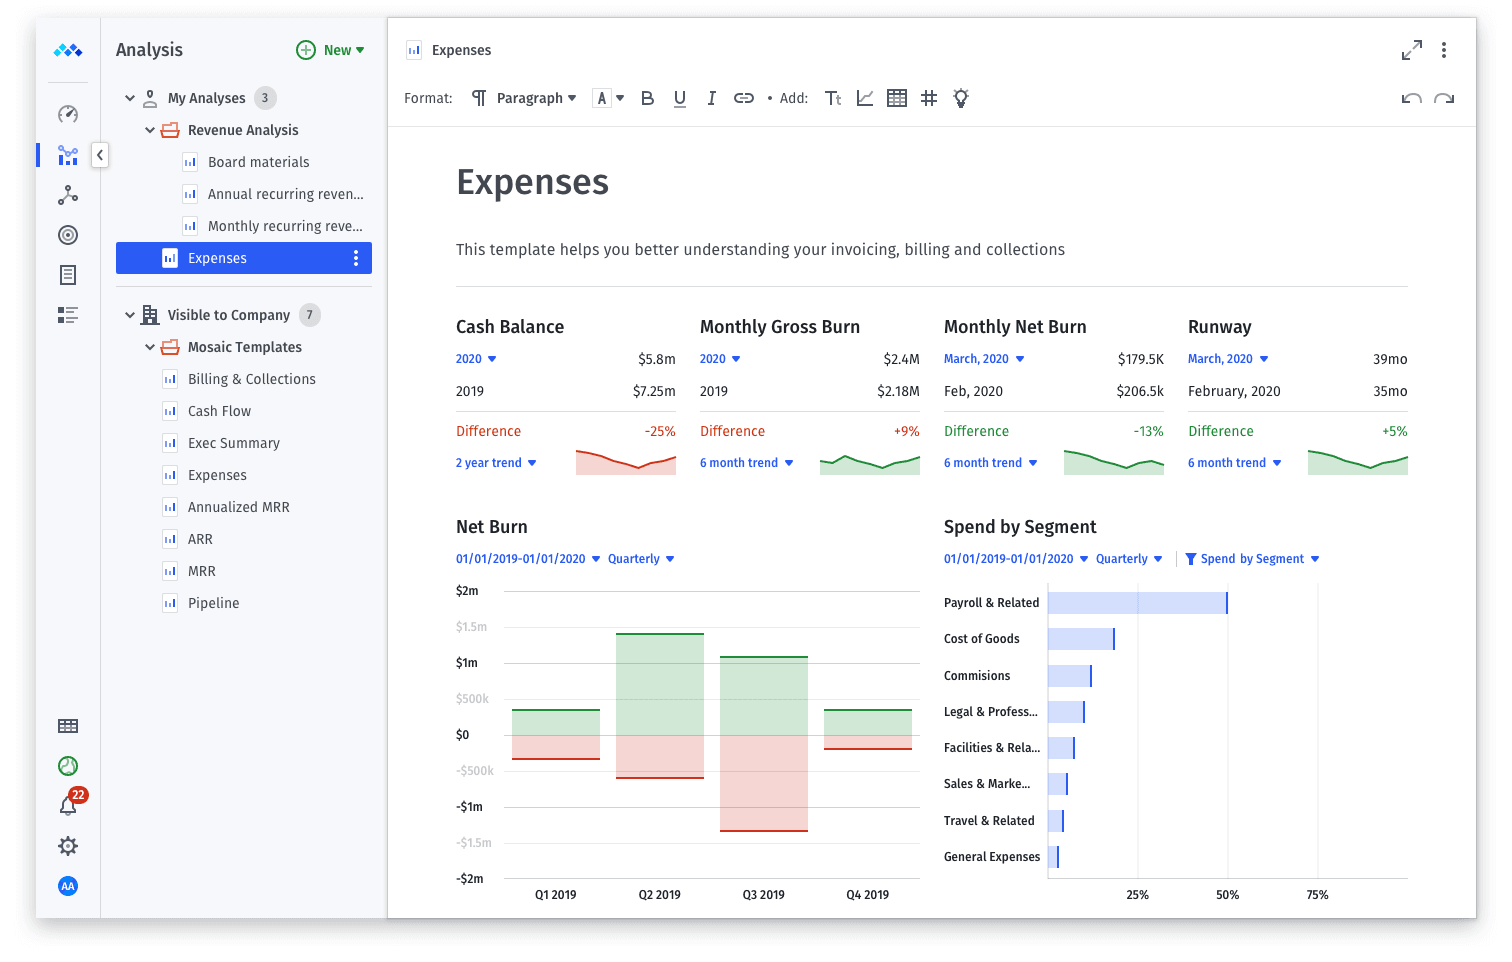
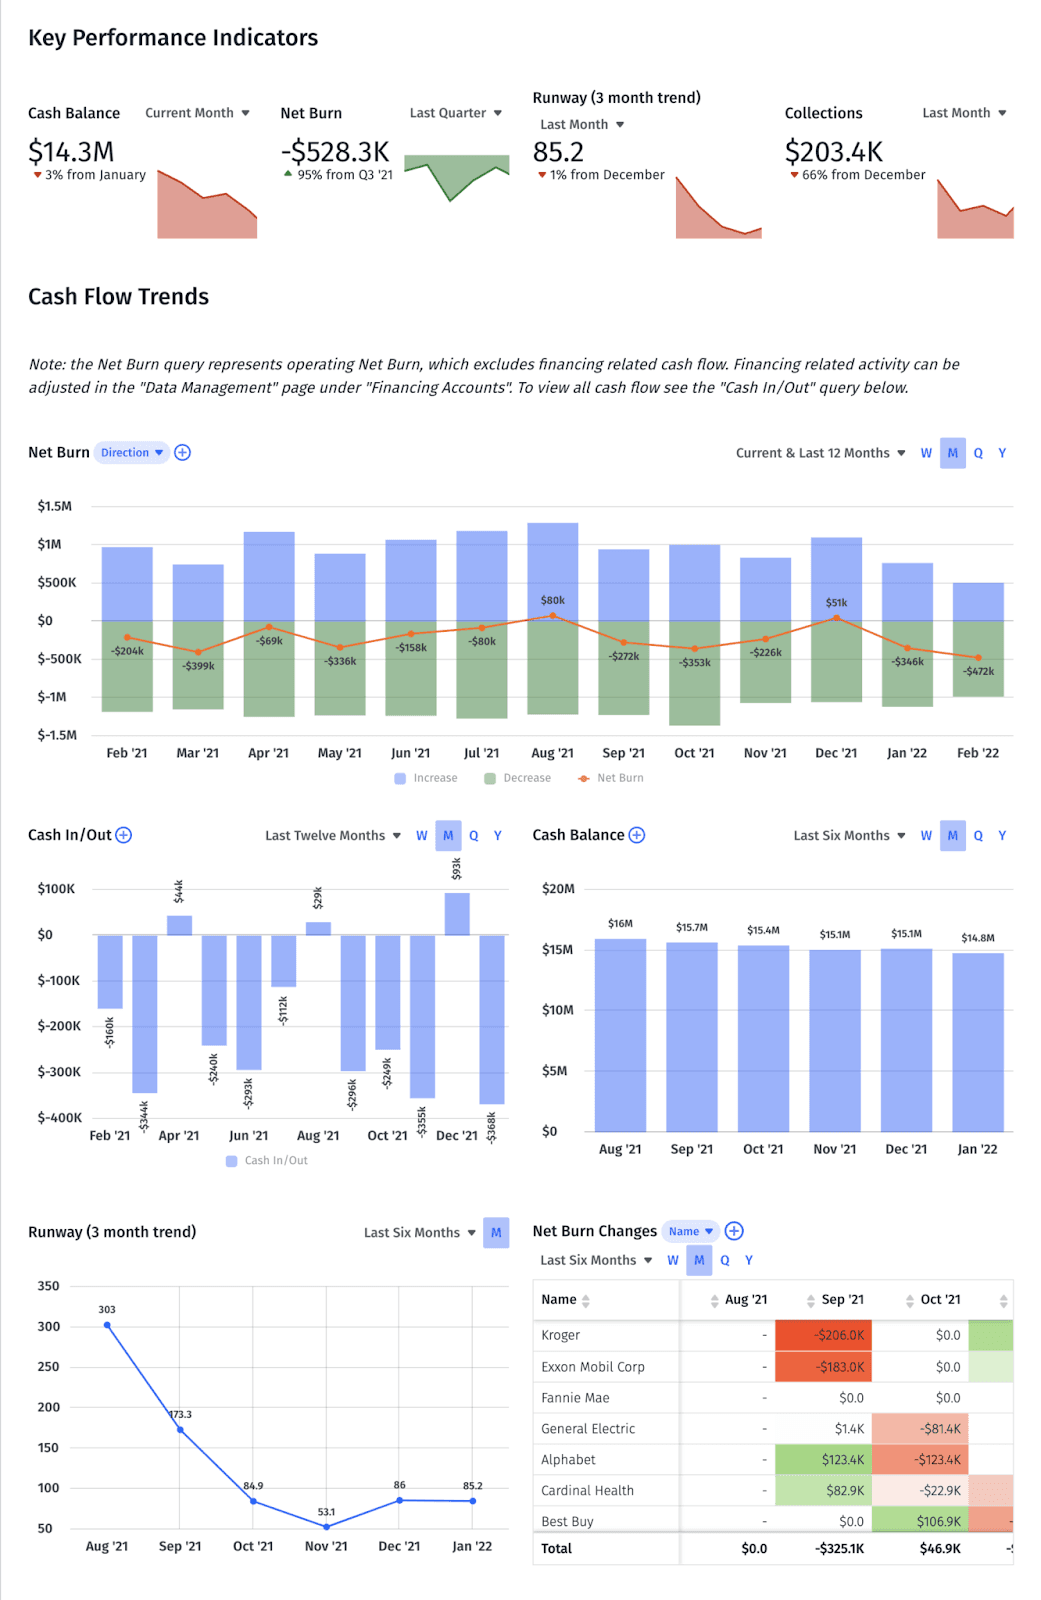
If you use a financial intelligence tool like Mosaic, your cash flow dashboard might look something like this:
7. Collections Effectiveness Index
Outstanding customer invoices can be a drag on your company’s cash flow. That’s why it’s important to monitor your Collections Effectiveness Index, which measures how good your accounts receivable (AR) team is at collecting payments.
An effective and efficient AR team is critical for every business, as it indicates healthy billing operations. This is especially the case if you’re a subscription SaaS business. Subscription models are particularly susceptible to changes in cash flow, so it’s crucial to maximize CEI.
A high CEI often means you provide accurate invoicing, clear payment terms, persistently follow up with delinquent customers, and regularly communicate with debtors.
The formula to calculate CEI is complicated, but it tracks every step in the payment journey, from creating an invoice to receipt of payment:
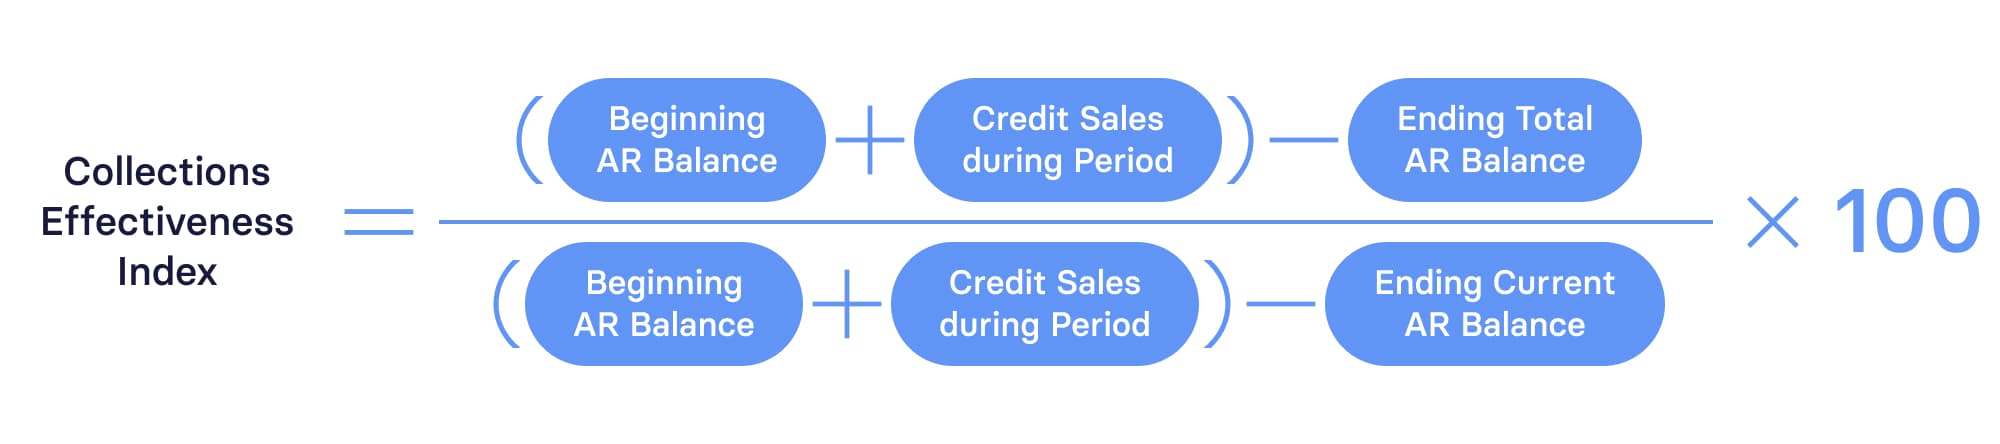
Every business aims for a 100% CEI, but if your CEI falls below 80%, it’s time to take a harder look at your billing and collections processes.
If your CEI isn’t where you’d like it to be, you’ll want to look at this metric in tandem with other accounts receivable KPIs to determine the best course of action. You can track CEI in real-time along with Accounts Receivable Turnover, AR Aging, and more in Mosaic dashboards.
Best Practices for Analyzing Cash Flow Metrics
Now you have a grasp on the most important metrics to monitor — but what do you do with all that data? To glean the financial insights you need from the mountain of info, regularly perform a cash flow analysis.
First, you’ll pull financial statements for your preferred period. From there, it’s easier to evaluate your company’s long- and short-term liquidity and plan for the future.
When performing your cash flow analysis, following a few best practices can streamline the process and even improve your cash management.
Communicate With Department Heads
Staying in touch with departments means you’ll know about big expenses coming down the pipeline so you can proactively manage cash flow.
For example: Marketing is planning a last-minute campaign to promote an upcoming customer conference. They need to spend $10,000 on paid ads and newsletter placements. While you may have more than $10,000 sitting in the bank, if you don’t know this expense is coming, you won’t be prepared when this amount shows up on the balance sheet.
However, meeting regularly with Marketing will give you visibility into their project roadmap and corresponding expenses.
Map Out Upcoming Tech Rollouts
As your business grows, you’ll eventually need to update existing systems or add new ones to your tech stack. Any software additions or upgrades will come with a hefty price tag and will inevitably impact your company’s cash flow.
To avoid sticker shock, proactively plan for your tech implementations. Finance can collaborate with relevant stakeholders to map out tech needs ahead of time. Whether it’s Marketing adopting a new email marketing tool, adding extra seats for your CRM for new Sales headcount in H2, or DevOps upgrading to Azure, you can use Mosaic to create scenario analysis examples. These scenarios can help you proactively plan for these rollouts without depleting your cash flow.
Close Those Books Faster
It’s impossible to get a clear picture of your business’s financial health if it takes three weeks to close your books. When performing a cash flow analysis, you want real-time visibility (or as close as possible) to get an accurate picture of the company’s finances.
But that requires the most up-to-date cash flow data. Otherwise, you’re stuck trying to fix last month’s financial problems. Closing your books as quickly as possible makes it easier to spot spending trends and optimize your cash flow accordingly.

That’s easier said than done for multinational corporations. The more countries you operate in, the more complex your finances. That was the case with next-generation bot builder Botpress.
The Quebec-based company struggled with month-end close deadlines for their Canadian and U.S. entities — until they partnered with Mosaic. With a little help from Mosaic, Botpress gained real-time visibility into their financial data and shortened their close cycles by 87%.
Mosaic: Your Partner in Cash Flow Management
Don’t lean on outdated spreadsheets and siloed data sources to manage your cash flow. Instead, give your high-performing finance team full visibility into your business’s performance with Mosaic.
The Mosaic platform delivers fast, powerful cash flow insights to drive more informed decisions. Use out-of-the-box dashboards to keep a close eye on your important cash flow metrics, or create custom metrics with simple, built-in formulas. When you can visualize where every dollar is going in real time, it’s easier to streamline your cash flow management.
That was Sourcegraph’s experience with Mosaic. The code-search tool for developers raised a $50 million Series C funding round in 2020 and needed a better way to monitor their cash flow and improve their cash management to fund their long-term growth.
At the time, their finance team reviewed cash flow quarterly — but with new, far-flung investors and board members on board, they needed to provide real-time visibility that was also remote-friendly.
That’s where Mosaic came in. Upon rollout, Mosaic helped their finance team access ERP and CRM data in minutes instead of waiting three days.
“Mosaic is now my go-to tool to understand what’s happening across our entire business,” said Tommy O Donnell, Manager of Financial Planning and Analysis at Sourcegraph. “It allows me to confidently tell the story of our financial investments and cost from the P&L perspective by looking directly at real-time interactive dashboards and reports.”
Now, Mosaic is fully integrated into its financial systems and has saved Sourcegraph hundreds of hours on manual analysis and reporting. The team still leans on Mosaic’s cash flow analysis template and Analysis Canvas to dig into granular transactions, automatically calculate the metrics that matter most to their business (like net burn), and feed them into pre-populated reports.
Thanks to these features, it’s easier than ever to rely on up-to-date cash flow data to inform their headcount planning and investment strategy.
Integrating Mosaic into Your Financial Strategy
Mosaic is purpose-built to work hand-in-hand with your current financial systems. The platform easily integrates with your existing tech stack so you can continue to use the tools you already know and love.
As a result, you can use Mosaic as a command center for monitoring your existing financial strategy. Pulling in data from across systems breaks down silos and serves up powerful insights in real time. This streamlined process also saves you time and effort — companies spend an average of 70% less time on data aggregation and get insights and reports 10 times faster with Mosaic.
Beyond Cash Flow: The Comprehensive Capabilities of Mosaic
Mosaic offers far more than just cash flow management features. With Mosaic, you get a suite of robust tools to help your business with all aspects of financial management, from planning to modeling to analysis to collaborative budgeting and beyond.
Conditions impacting your company are constantly changing, and your business’s financial plans have to be able to adapt. Mosaic makes it simple to model what-if scenarios to predict different outcomes, compare goal progress with real-time budget vs. actuals, and collaborate on plans with department leads. Cut your planning cycle in half and re-forecast in minutes when needed to keep up with the world around you.
And while Mosaic is excellent at tracking cash flow metrics, the platform serves up a variety of other financial insights. Find all your key financial metrics in one place, whether it’s billings, bookings, headcount, burn rate, or beyond. Check out Mosaic’s Metrics Catalog to review all the financial intelligence you can have at your fingertips.
Need a little extra help ticking off tasks on your to-do list? Test out the power of automation and artificial intelligence with Arc AI, Mosaic’s new chat-based AI. Use simple, conversational language to ask Arc to highlight performance drivers, summarize financial trends, and surface explanations and context for any forecast variances.
Mastering Cash Flow with Mosaic
Staying on top of your company’s cash flow is a surefire way to stay abreast of the business’s financial health. But that isn’t always an easy task with dozens of potential metrics to monitor and mountains of data to analyze.
However, mastering your cash flow doesn’t have to be an overwhelming prospect. With Mosaic, every crucial cash flow metric is accessible at the click of a button. Bring together disparate data sources into clear, cohesive, custom dashboards everyone at your company can understand. And with real-time visibility into your financial performance KPIs, you’ll get a deeper understanding of your company’s fiscal health in minutes — not hours.
Request a personalized demo to see Mosaic in action.
Cash Flow Metrics and KPIs FAQs
How can Mosaic help in tracking and analyzing cash flow metrics?
With help from the right tools, you can keep a finger on the financial pulse of your business. A platform like Mosaic delivers deep insights into the heart of your business by tracking and analyzing cash flow metrics like net burn, runway, and beyond. Identify trends, examine expenses, and compare your forecasted budgets to actual performance.
What are common mistakes in managing cash flow?
How does improving cash flow impact a business's growth?


Own the of your business.
