

Table of Contents
The Shift Towards Data-Driven AP Management
Decisions are more data-driven in finance than in any other area of the business. Given that a company’s bottom line and long-term viability hinge on these numbers, paying close attention to them is absolutely essential.
And it’s not just us saying this. According to Nathaniel Katz, CFO of Rokt, “A lot of what the CFO job at a fast-paced, high-growth company entails is helping the rest of the business move fast by making informed decisions that leverage trusted data…”
Accounts payable metrics are important in any AP process. Understanding where, when, and why a company spends its money helps you better manage these expenses, prioritize the ones that matter most, and cut back on nonessential spending when needed.
But here’s the thing: this isn’t just about tracking your company’s expenses and spending patterns. You need real-time data to harness these insights effectively and stay ahead in a highly competitive SaaS market.
With immediate access to up-to-date financial information, companies can quickly tackle cash flow issues, secure better payment terms, and fine-tune their working capital. More importantly, real-time insights into accounts payable make it possible to spot trends and anticipate potential problems.
And this is exactly where the Mosaic strategic finance platform comes into play. Mosaic breaks down data silos, connects cross-system data, and offers a single source of truth — all in real-time. This way, it’s easier for you and your team to get critical answers to make educated decisions.

By streamlining data aggregation and simplifying analysis, Mosaic lets you focus on big-picture goals and not sweat the details, all while knowing your business moves are based on reliable data — this is important when decisions need to be made quickly to put you on the track to hit your profit goals.
3 Accounts Payable Metrics for SaaS
Now that you understand what AP metrics are and how they matter, let’s dive into some key ones your company should monitor, why they’re essential, and how Mosaic makes tracking and analyzing them easy. Below, we share three important AP metrics for SaaS.
1. Average Cost to Process an Invoice
The average cost to process an invoice, or AP cost, tells you how much it costs to handle each invoice during a company’s payment cycle, including labor, technology, and overhead related to processing these invoices.
You calculate this by dividing your invoice processing costs by the total number of invoices processed in a certain period.

Usually, if this average cost is low, you’re optimizing your accounts payable process (typically with AP automation software), which helps cut operational costs and boosts your bottom line. But if it’s high, it could point to inefficiencies in your payable process, which might affect your profits.
In 2022, the American Productivity and Quality Center found that “top performers (those in the 25th percentile) spend $1.42 per invoice on the process, while bottom performers (those in the 75th percentile) spend more than three times that amount at $6.00 per invoice.”
In SaaS, where there’s typically a large volume of transactions happening all the time, managing all these invoices can get tricky — there’s a greater chance of making payment errors, such as overpayments, duplicate payments, or duplicate invoices, resulting in discrepancies when working out this metric.
That’s where Mosaic steps up. Mosaic’s financial reporting software instantly gives you real-time data on invoice status, including details on overdue, closed, or open invoices in both dollar amounts and counts.
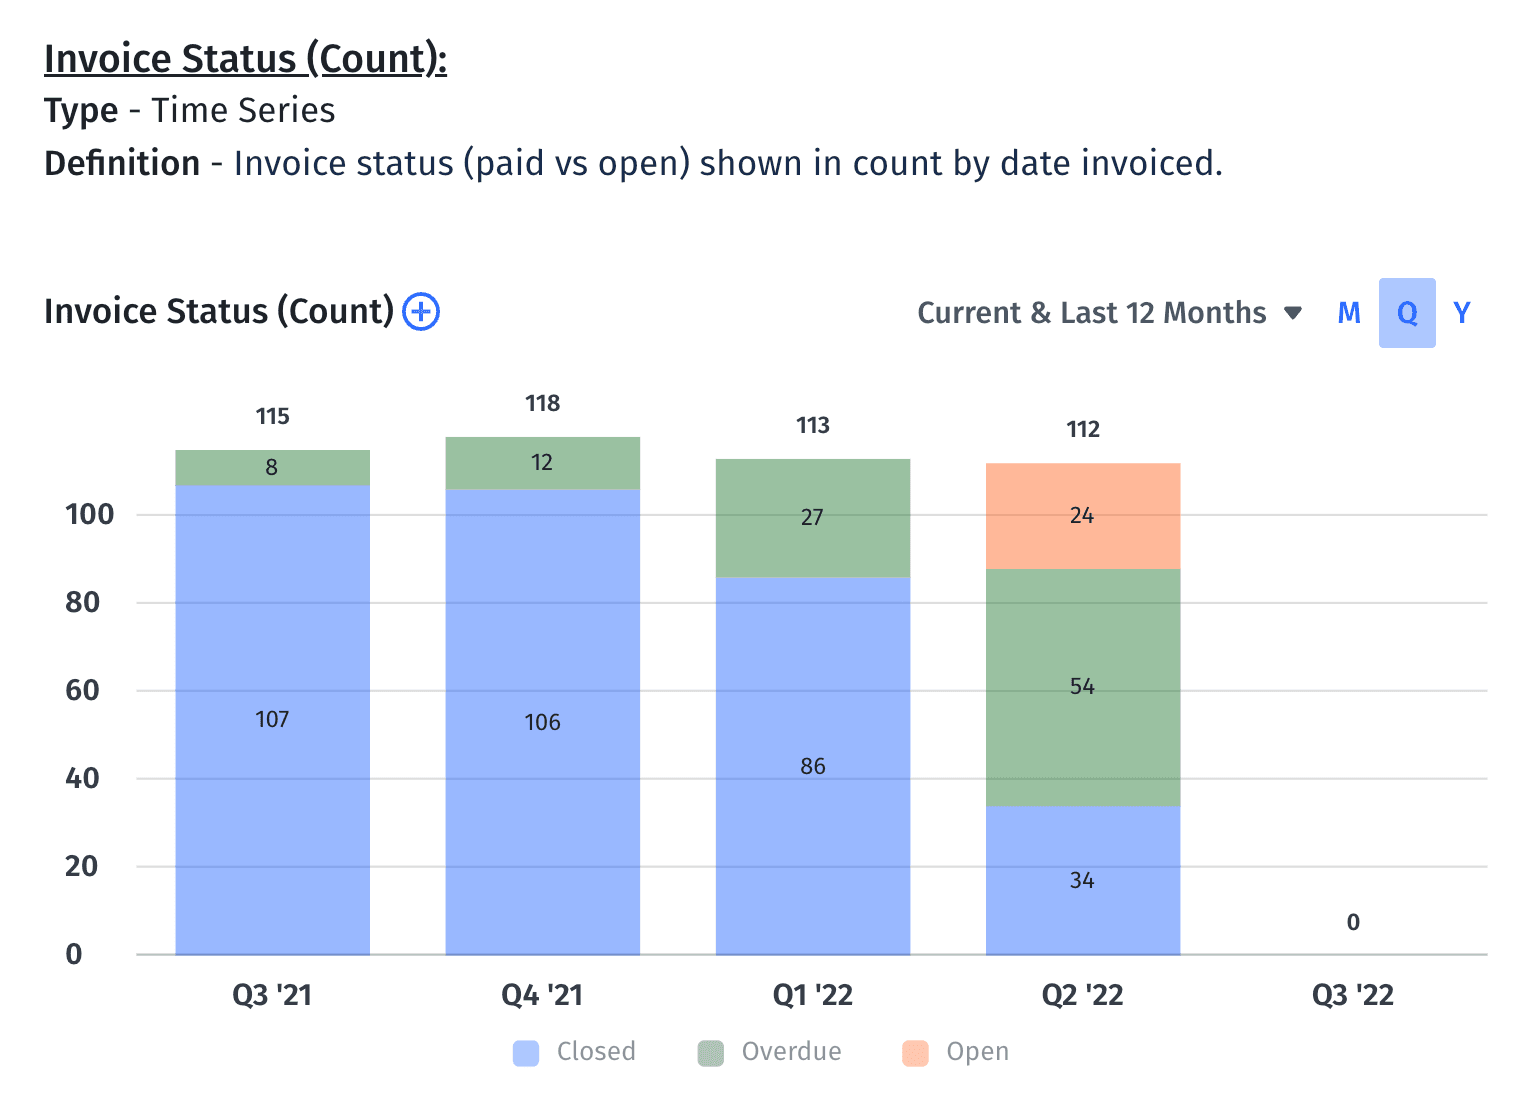
This way, you can quickly sift through invoice data to identify critical details, such as which clients have the most overdue invoices, and focus your collection efforts on high-value invoices or key accounts rather than just the total number — this can make all the difference to your bottom line.
For example, you might prioritize a single invoice that’s high-value and overdue from “Company B” over multiple smaller ones from “Company A,” which, when combined, still have a lower value than the former.
2. Invoice Processing Cycle Time
Invoice processing cycle time, or invoice processing time, is how long a company takes to process an invoice, from when it’s received to when it’s fully paid. This cycle typically involves receiving the invoice, verifying its details, approving it, and finally making the payment.
Your invoice processing cycle time is an important AP metric because it indicates the speed and efficiency of your payment cycle. When done right, your invoice processing cycle time can improve cash flow management and strengthen your supplier relationships. On the other hand, slow processing times can lead to late payments and affect the relationships with your creditors.
When you calculate your AP metrics, including invoice processing cycle time, you streamline the workflow, cut general and administrative costs, and reduce the chance of bottlenecks like errors and late invoice payments, which could lead to penalties and harm the company’s reputation.
3. AP Turnover Ratio
AP turnover ratio indicates how frequently a business pays its creditors in a specified period. This metric serves as a key performance indicator (KPI) and shows you how well the company manages its cash flow and if it pays off its accounts promptly.
A low AP turnover ratio might suggest the company is in financial distress or having trouble paying off accounts. However, it could also reflect that the company is making strategic financial decisions for future gains. On the other hand, a high AP turnover ratio shows quick payment of accounts, which lenders and suppliers usually want.

AP turnover typically measures short-term liquidity and financial commitments. However, when viewed over a more extended period, it gives you valuable insight into the company’s financial health. Essentially, this metric quantifies the rate at which your company pays off its balances — this is important to investors and creditors.
Here’s why this is important: AP turnover plays a vital role in helping you evaluate your company’s financial state. You may already have AP software that tracks your accounts payable and even provides a turnover metric. But that’s just part of the picture. To truly understand these metrics, it’s essential to look past the numbers and understand the “why” behind the story — and that’s what Mosaic does.
For instance, if your AP turnover is too low or too high, you probably need a ratio analysis to identify what’s causing the metric to go outside your company’s or SaaS benchmarks. Also, you’d need easy access to your key metrics without dealing with the manual process of data entry into Excel from different source systems and financial statements. After all, this eats into your valuable time.
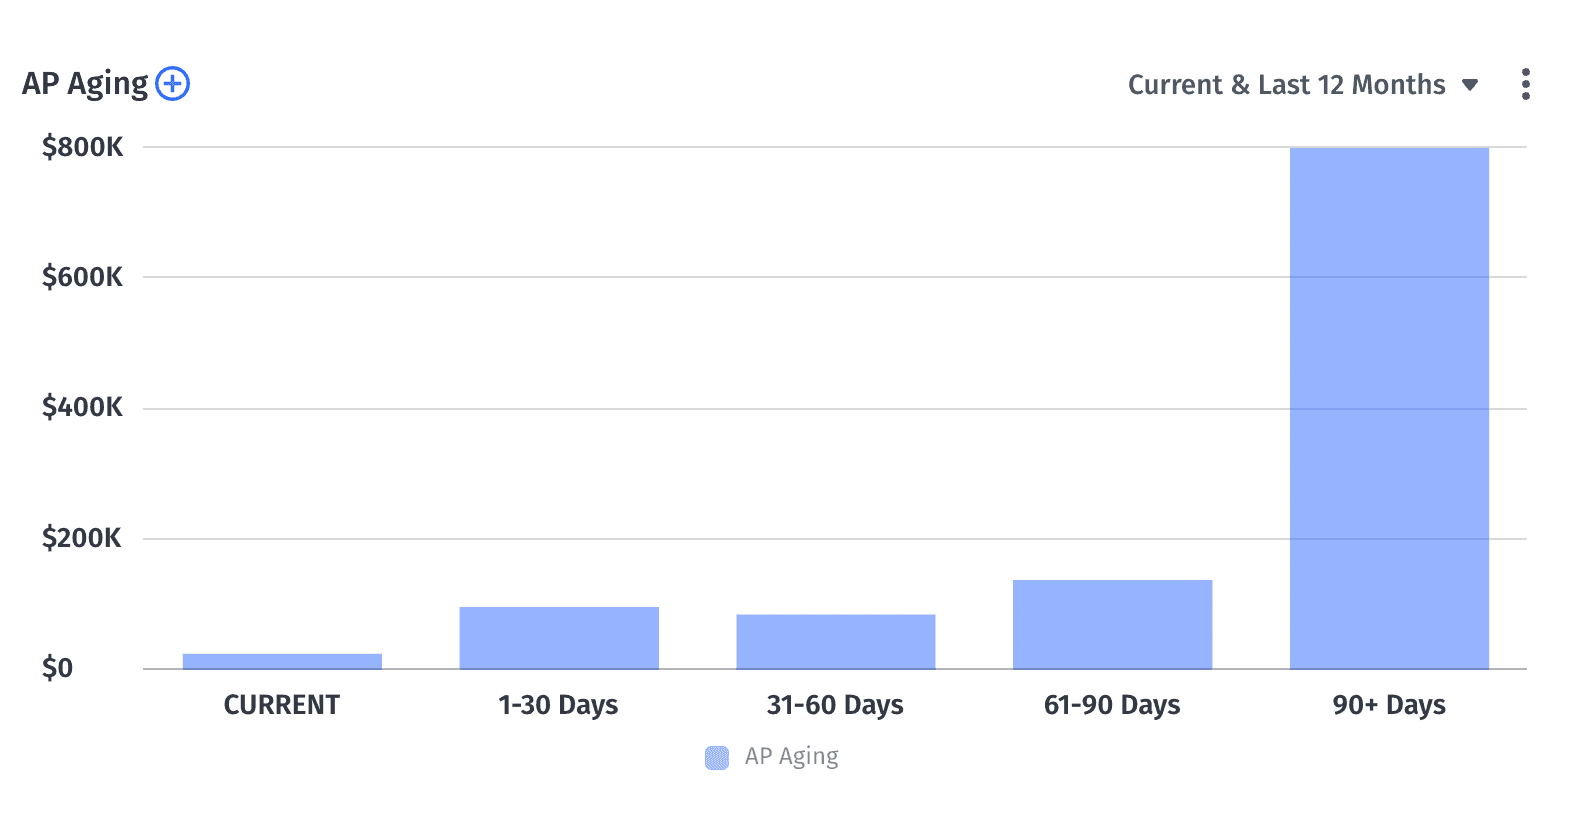
Luckily, Mosaic makes accounts payable automation possible, specifically through data collection, giving you a detailed look into your metrics. Mosaic seamlessly integrates with your ERP system to let you monitor your AP turnover in real time. With 150+ prebuilt metrics and dashboards, Metric Builder offers instant access to essential data, such as AP aging reports and balance sheets, enabling you to manage your business’s spending, billing, and collections efficiently for better cash flow insights.
Leveraging Mosaic for Enhanced AP Metrics
Mosaic makes your AP metrics super easy to access and monitor, plus improves cross-team collaboration, as everyone can focus on spotting opportunities to boost AP performance and drive business growth.
Mosaic doesn’t just save finance teams the time-consuming data collection and entry task. Sure, getting the data you need is important. But the true value lies in being able to access it quickly, which ensures you can spend your time analyzing the AP metrics and creating strategies to move your business forward.
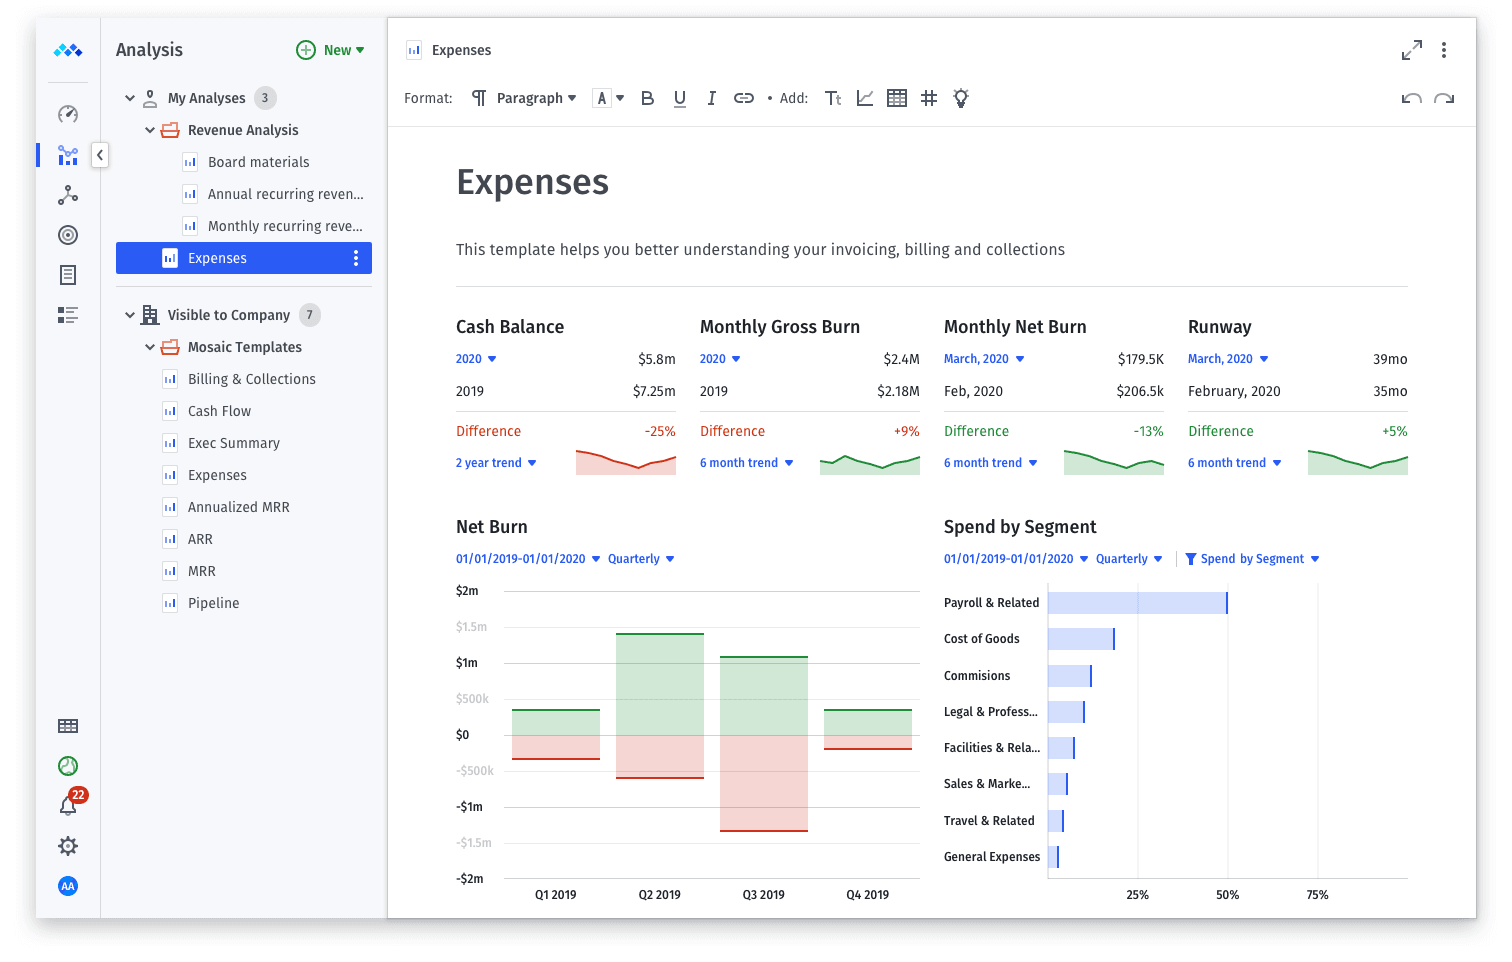
That’s where Mosaic takes your financial planning and analysis to the next level. For instance, our financial dashboards are built to empower teams to make strategic decisions. These dashboards aren’t just about giving our customers a pretty way to visualize the numbers — they give you real-time insight into both the numbers and the stories behind them, helping the entire business (not just finance) make smart, well-informed decisions.
Mosaic lets you effortlessly import data from any system or format, whether it’s your ERP, CRM, HRIS, billing system, data warehouse, or a simple flat file upload — it’s all readily accessible. This includes financial data, employee data, pipeline and revenue data, operational data, as well as billing, revenue, and collections data. In other words, you have a wealth of information right at your fingertips.
Ultimately, a comprehensive financial analysis is central to proactive decision-making. With Mosaic, you’re set up for success as it empowers you to always to look ahead and leverage agile planning to help the business succeed.
Empower Your Team With More Than Accounts Payable Metrics
Like all metrics, the insights you gather and the decisions you make should be based on reliable data. That said, AP metrics are one half of the puzzle in helping you understand your company’s financial condition. To make educated decisions based on these numbers, you need to look at other metrics in tandem to ensure your company’s set up for success.
Learn how Mosaic can empower your team to analyze AP metrics, among others, to drive efficiency and make forward-looking decisions. Request a personalized demo today.
Accounts Payable Metrics FAQs
What is the average cost to process an invoice?
As of 2022, according to the American Productivity and Quality Center, the most efficient performers spent $1.42 per invoice. And less efficient performers spent significantly more, at $6.00 per invoice.
However, the average invoice payment processing cost varies based on whether the company is processing a paper invoice or digital invoice, using automation software, the total number of invoices, the number of suppliers, and the available payment options.
How often should accounts payable metrics be reviewed?
How can Mosaic help in tracking and improving accounts payable metrics?


Own the of your business.
