Understanding Your Sales Funnel Conversion Rates
What Is a Sales Funnel Conversion Rate?
Sales funnel conversion rate is the percentage of prospects who move through various stages of the sales funnel to complete a purchase or other desired outcome. This rate is crucial for understanding the effectiveness of your sales process and marketing strategies.
Categories
Table of Contents
The Stages in a Sales Funnel
The most universal way to outline the stages in a sales funnel is the journey from awareness to interest, consideration/evaluation, engagement, and action. But more importantly, each of these stages correlates to a specific metric that marketing, sales, and finance leaders have to be in lockstep on when evaluating go-to-market efficiency.
The metrics that define your marketing funnel and sales funnel stages will depend on how your go-to-market motion operates. However, the most common metrics for funnel stages — especially for sales-led SaaS companies — are lead, MQL, SQL, opportunity, and closed deal.
Lead (Awareness Stage)
Leads are contacts at the top of the funnel who are likely just finding out about your company. Whether you attract them through organic efforts like content marketing and SEO or paid marketing like PPC or social media ads, these prospects are new website visitors who have opted into giving you their contact information for the first time. The number of leads you drive often depends on the strength of your conversion rate optimization — how well can you attract new visitors and incentivize them to enter your funnel?
MQL (Interest Stage)
A marketing qualified lead (MQL) is a lead that the marketing team has identified as more engaged than others and, therefore, more likely to be interested in buying. The conversion from lead to MQL usually involves nurture sequences with email marketing and a lead-scoring system that uses number of conversions, page views, email opens, and other important metrics as a proxy for high-level purchase intent.
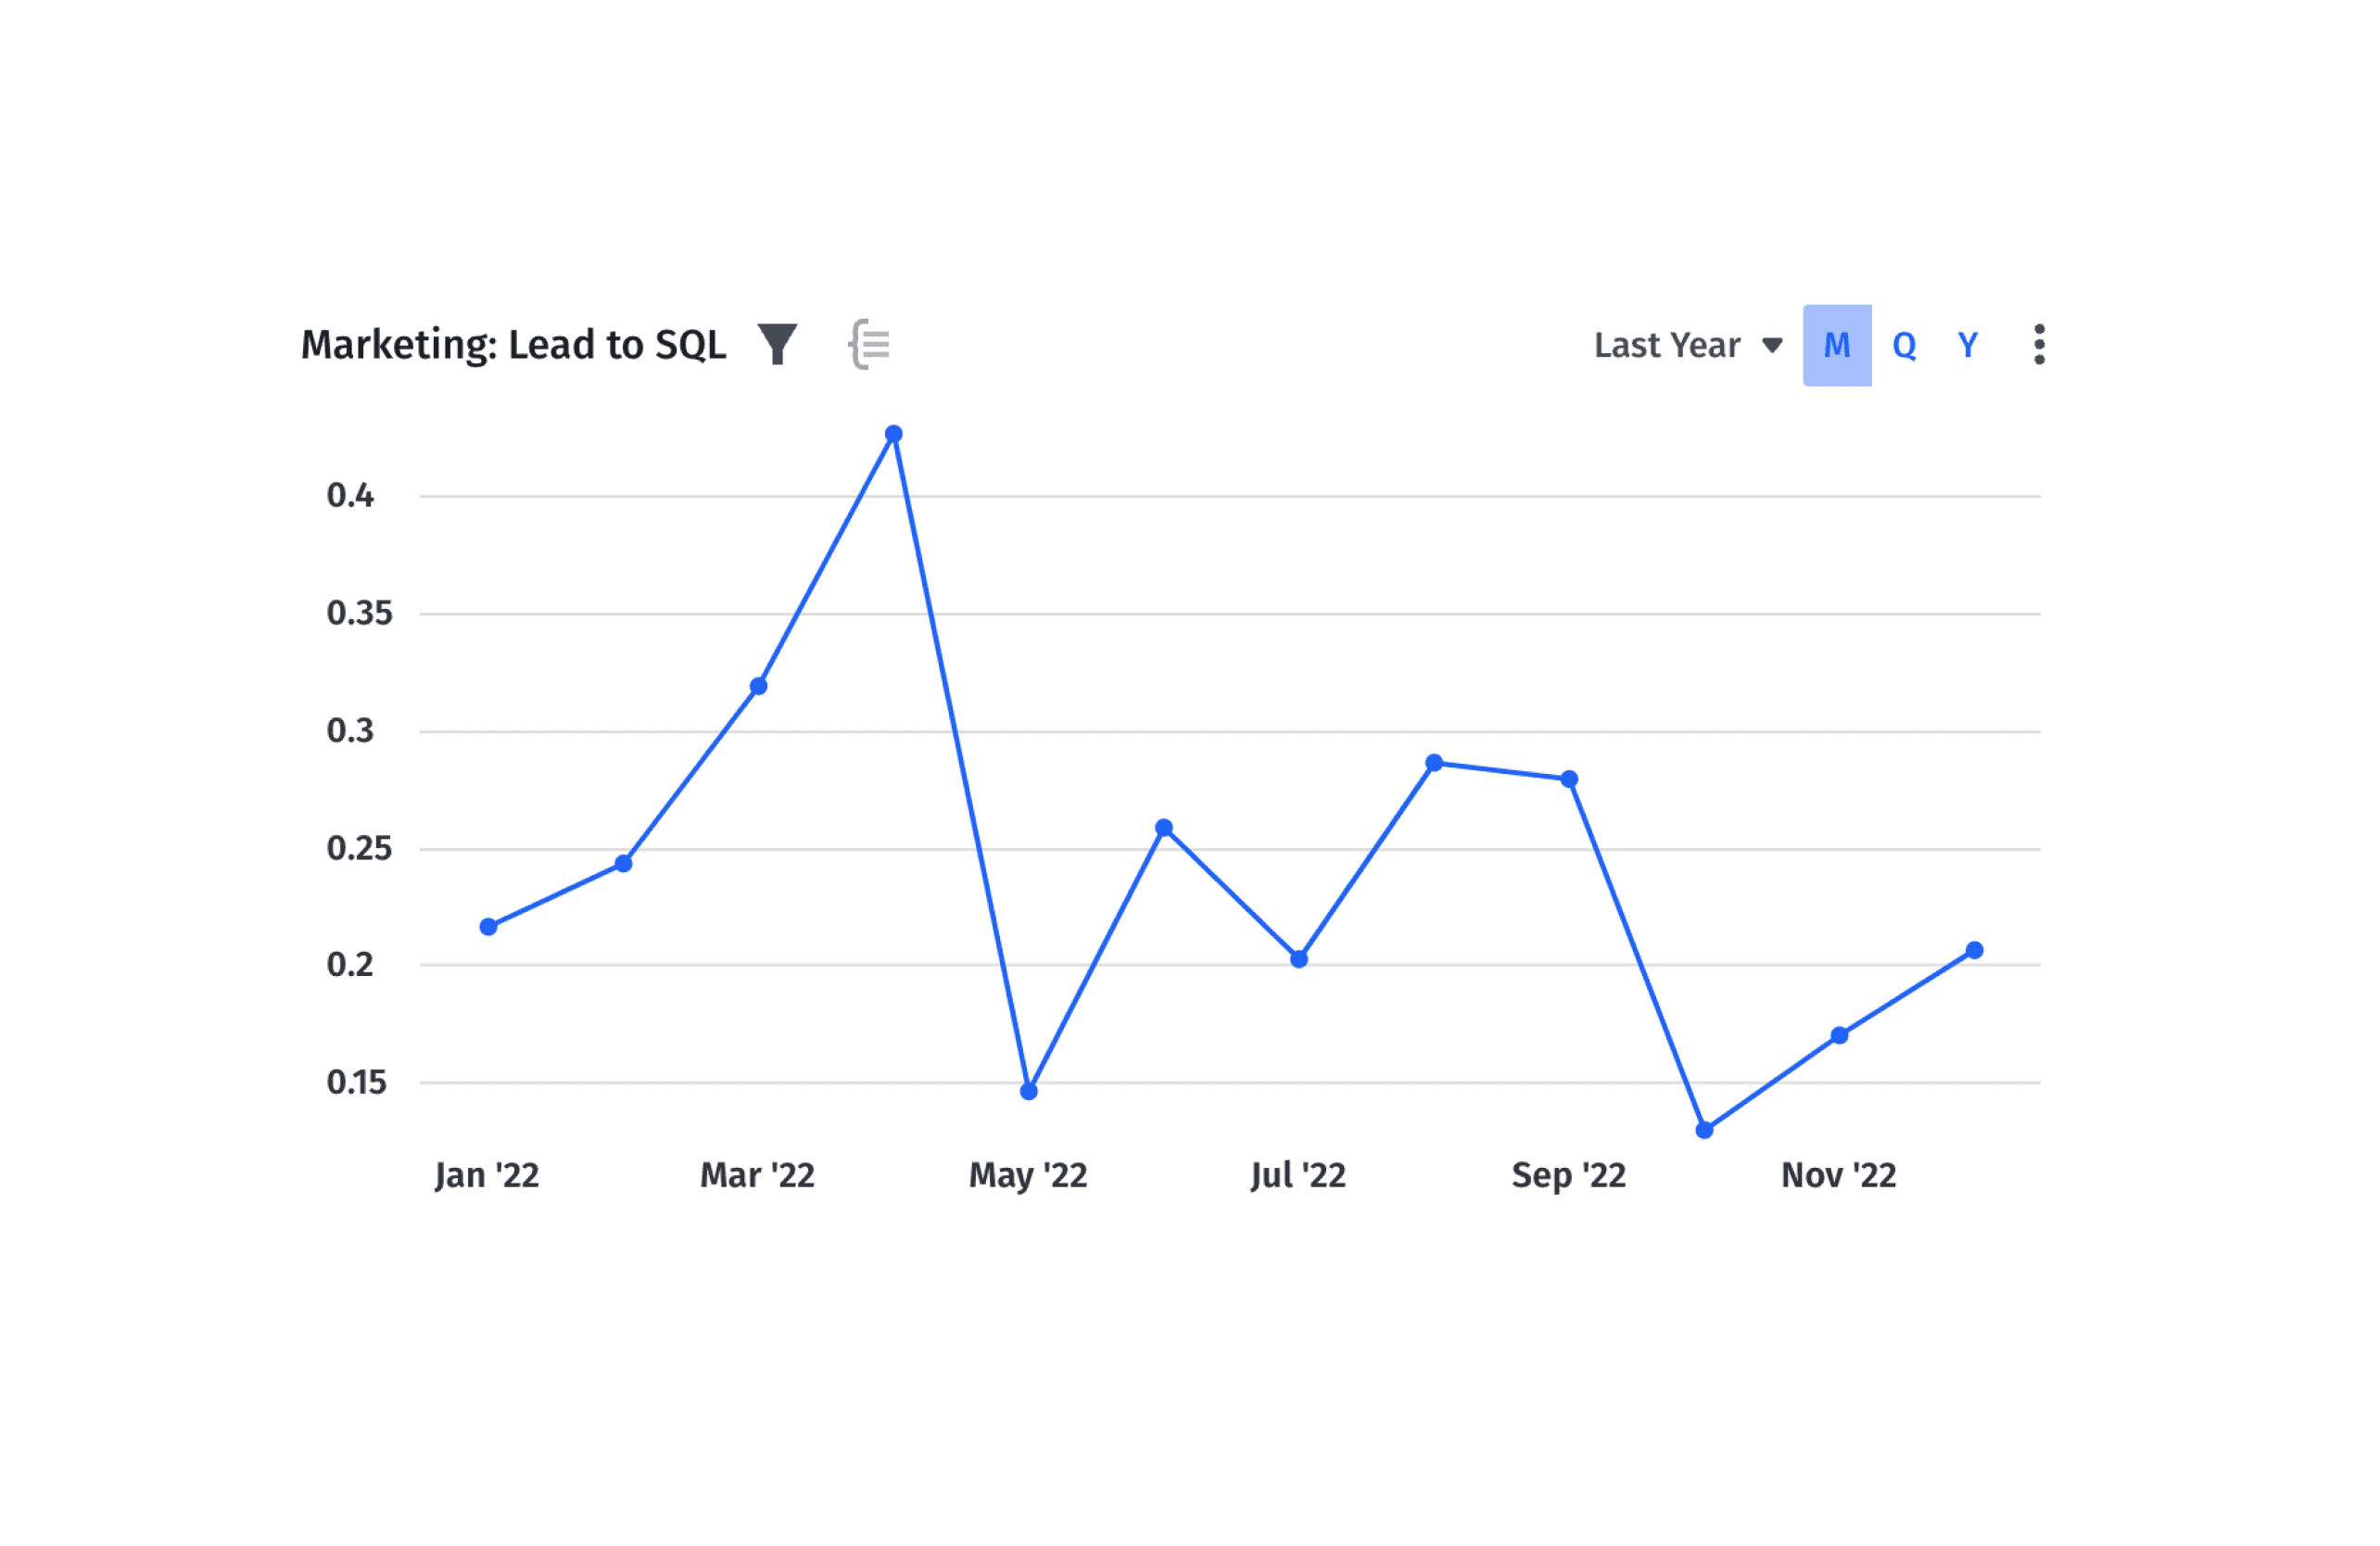
SQL (Consideration/Evaluation Stage)
A sales qualified lead (SQL) is one that has transferred from marketing-owned to sales-owned based on an agreed-upon set of rules. At this stage, leads will have responded to outbound communications or taken advantage of calls to action that are more relevant to the bottom of the funnel, like a demo request.
Opportunity (Evaluation/Engagement Stage)
The bridge between an SQL and an opportunity is all about declared purchase intent. In many cases, an SQL will become an opportunity when the contact gets beyond the initial discovery call with a salesperson and the full sales cycle is underway. The main conversion levers at this stage are often things like social proof, customer testimonials, and other forms of evidence that the product can serve the prospect’s specific needs. It’s also when the sales team has to engage with a number of people beyond the initial contact, ensuring all personas on the buying team are bought in before closing the deal.
Closed Deal (Action Stage)
The final stage to consider for sales funnel conversion rates is the point where prospects become closed-won (or lost) deals. This is when you’re looking at more specific sales performance KPIs like sales conversion rate, average sales price, sales cycle length, and annual contract value. The customer’s journey doesn’t end here — you still have upsells, cross-sells, and customer retention to consider beyond the initial deal — but it’s the final step of the new customer’s sales conversion.

How to Measure and Calculate Sales Funnel Conversion Rates
The sales funnel conversion rate formula is the same regardless of which stages you’re measuring — number of contacts in the later stage of the funnel divided by number of contacts in the earlier stage, all multiplied by 100.
Use this general formula to come up with conversion rates from stage to stage:
- Lead to MQL
- MQL to SQL
- SQL to opportunity
- Opportunity to closed-won deal
You can also take a more general view of your sales funnel efficiency by comparing top-of-funnel stages to bottom-funnel stages. For example, you could find the conversion rate from lead to opportunity and see how you perform against historical and industry benchmarks. Additionally, understanding your sales velocity is crucial as it helps measure how quickly leads move through each stage, directly impacting your overall conversion rates
Funnel Conversion Rate Calculator
Your Conversion Rate
0%
How Conversion Rates Impact Business Growth
A higher conversion rate indicates that your marketing and sales efforts are effective, leading to more customers and increased revenue. A low conversion rate could be an indication of possible impediments in the sales process that need to be addressed.
Identify Bottlenecks in Your Sales Funnel
Analyzing each stage’s conversion rates can help you identify potential problem areas where prospects might be dropping off before becoming customers. For example, if there is a significant drop-off between the lead generation stage and scheduling demos with prospective clients, it could indicate issues with how leads are being nurtured or followed up by your team.
Reveal Areas of Opportunity for Growth Efficiency
Focusing on improving these identified bottlenecks will have a direct impact on overall business growth as it increases the number of qualified leads who eventually become paying customers:
- Optimize marketing strategies. Reviewing data from past campaigns can provide insights into which tactics resonate best with your target audience. Use this information to refine messaging, run A/B testing, optimize landing pages, and improve targeting for future marketing campaigns.
- Enhance lead nurturing processes. Implementing an effective lead nurturing strategy, such as personalized email sequences or targeted content offers, can keep prospects engaged throughout their buyer journey until they are ready to make a purchase.
- Invest in sales enablement. Make sure your sales team has the necessary materials to keep prospects engaged in the mid and bottom-funnel stages. This could include one-pagers about product features, niche-specific case studies, customers available to provide referrals and testimonials, and other forms of social proof that drive late-stage decisions.
Improve Revenue Forecasting Across the Business
An accurate view of your sales funnel conversion rates will improve revenue forecasting for the business. Executives will come to the marketing team with a top-down goal for business growth. Sales and marketing can work backward from that revenue target using conversion rates at each stage of the funnel to understand exactly how many leads, MQLS, SQLs, and opportunities they need to drive throughout the month, quarter, and year.
Sales funnel conversion rates are especially valuable for the relationship between marketing and finance. It provides solid footing for conversations between these two functions, enabling more strategic conversations about budget allocation and planning.

Other Sales Funnel Metrics to Measure Performance and Efficiency
In addition to sales funnel conversion rates, there are several other metrics that can help finance and accounting leaders at venture-backed B2B SaaS startups better understand their sales process’s efficiency. These metrics provide a more comprehensive view of your company’s performance and can guide strategic decisions for growth.
Average Deal Size
Average deal size is the average revenue generated from each closed sale. This metric helps you determine if your efforts in targeting higher-value customers or upselling existing clients are effective. To calculate the average deal size, divide the total revenue by the number of deals closed during a specific period. An increase in average deal size indicates an improvement in your sales team’s ability to target high-value prospects or increase the annual contract value within the existing ICP.
Sales Cycle Length
The average sales cycle length measures how long it takes for leads to move through your entire sales funnel — from initial contact until closing a deal. A shorter sales cycle typically means higher efficiency, as it allows you to close more deals within a given timeframe. You can calculate this metric by averaging the time taken for all deals closed during a specific period.
Lifetime Value (LTV)
Customer lifetime value (LTV) is a critical metric for B2B SaaS startups. It measures the total revenue generated by a customer throughout their entire relationship with your company. LTV helps you understand how much you can invest in acquiring new customers while maintaining profitability. Increasing LTV indicates that your product or service delivers lasting value to customers, leading to higher retention rates and long-term growth.
Customer Acquisition Cost (CAC)
Customer acquisition cost (CAC) measures the average expense of acquiring a new customer. This metric includes marketing and sales expenses associated with lead generation, nurturing, and closing deals.
CAC Payback Period
The CAC payback period, also known as months to recover CAC, calculates how long it takes for your company to recoup its investment in acquiring each new customer through recurring revenue streams. A shorter payback period means faster cash recovery from investments made in marketing and sales efforts.
How Strategic Finance Software Can Improve Sales Performance

How to Track and Optimize Sales Funnel Conversion Rates with Mosaic
While the formula for sales funnel conversion rates is simple, tracking these metrics in a way that drives strategic insights can be complicated for two reasons.
First, the data for the full sales funnel typically lives in multiple systems. Your marketing funnel metrics will exist in a marketing automation platform, whereas your sales cycle data lives in the CRM. Sometimes these platforms overlap, but not always. And second, a point-in-time view of the sales funnel conversion rate isn’t necessarily helpful — you’ll want automated updates to help drive decision-making in sales and marketing.
Mosaic’s Metric Builder makes it easy to aggregate data from point solutions as well as data warehouses like Snowflake, define sales funnel metrics exactly as needed for your business, and track conversion rates in real time.
Automating the manual process of customizing your sales funnel metrics month after month enables you to spend more time digging into the “why” behind your conversion rates. Should your marketing team be working on optimizing conversion rates at the top of the funnel? Or are the weaknesses really in the middle of the funnel? Have the sales team’s win rates dropped in recent months? What has changed to make that happen, and what can you do about it?
This is the kind of analysis that makes finance a more strategic partner to both sales and marketing. Want to learn how Mosaic and Metric Builder can make it happen for your business? Request a personalized demo today.
Sales Funnel Conversion Rate FAQs
What are average B2B funnel conversion rates?
Data from FirstPageSage and Gartner provide rough benchmarks for average B2B funnel conversion rates:
- Lead to MQL: 25% to 35%
- MQL to SQL: 13% to 26%
- SQL to Opportunity: 50% to 62%
- Opportunity to Close: 15% to 30%
These benchmarks will vary greatly depending on your go-to-market motion, ICP, and ACV. Focus as much or more on your own historical benchmarks to better understand performance.
How can Mosaic help with sales funnel conversion rates?
How do digital marketing efforts influence sales funnel conversion rates?
Explore Related Metrics


Own the of your business.
