Cost Per Opportunity
What Is Cost Per Opportunity (CPO)?
Cost per opportunity (CPO) is a measurement of how much a business is spending to drive each new highly qualified potential customer in the pipeline. Costs may include marketing and advertising expenses, sales team salaries, and anything else involved with attracting new business. CPO helps companies understand how efficient and sustainable their sales and marketing efforts are.
Categories
You can calculate CPO for all of sales and marketing, for outbound sales efforts, or for marketing activities. But it’s most often used as a metric to gauge the return on ad spend and ROI of your marketing channels. A low CPO is a good signal that your marketing efforts are connecting with the right audience and that marketing and sales are working together to efficiently identify and nurture quality leads. But this is only the tip of the iceberg.
Finance teams at B2B SaaS companies can use channel-by-channel CPO to improve scenario planning, improve budget allocations, and even improve cross-team collaboration. CPO can also help you identify precisely what is and isn’t working through your marketing and sales funnel when paired with other metrics like sales funnel conversion rates, ACV, and LTV.
Table of Contents
What Is a Sales Opportunity?
Opportunities are the most qualified type of prospect. For sales-led SaaS companies, an opportunity is the final stage in the marketing and sales funnel before a deal is closed and after sales team qualification. Opportunities are the stage at which a potential customer has demonstrated clear purchase intent and is evaluating your product or service.
The precise trigger action for a lead to go from SQL (sales qualified lead) to opportunity can vary from company to company. A new opportunity may be created, for example, when a sales development rep hands a lead off to an account executive or when a proposal/demo call is scheduled.
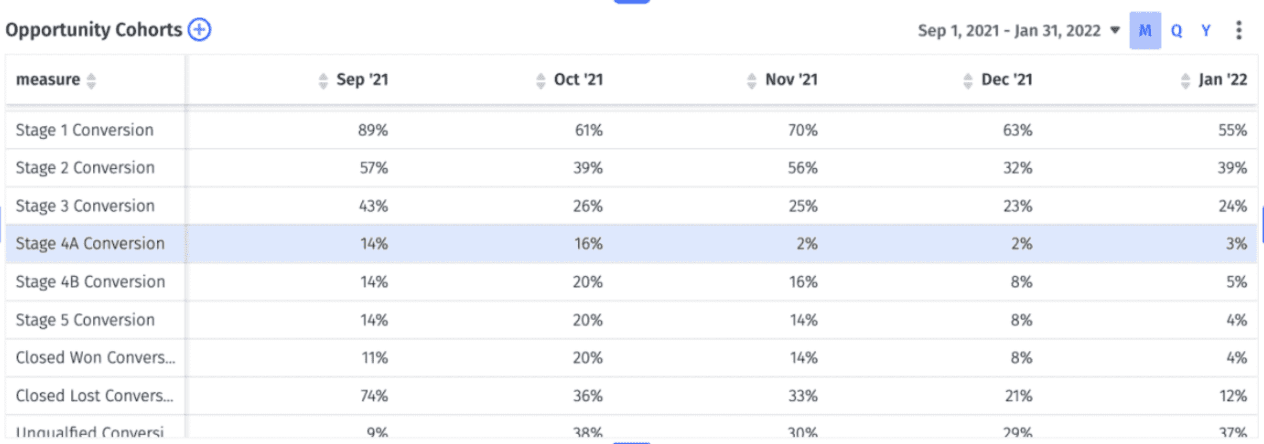
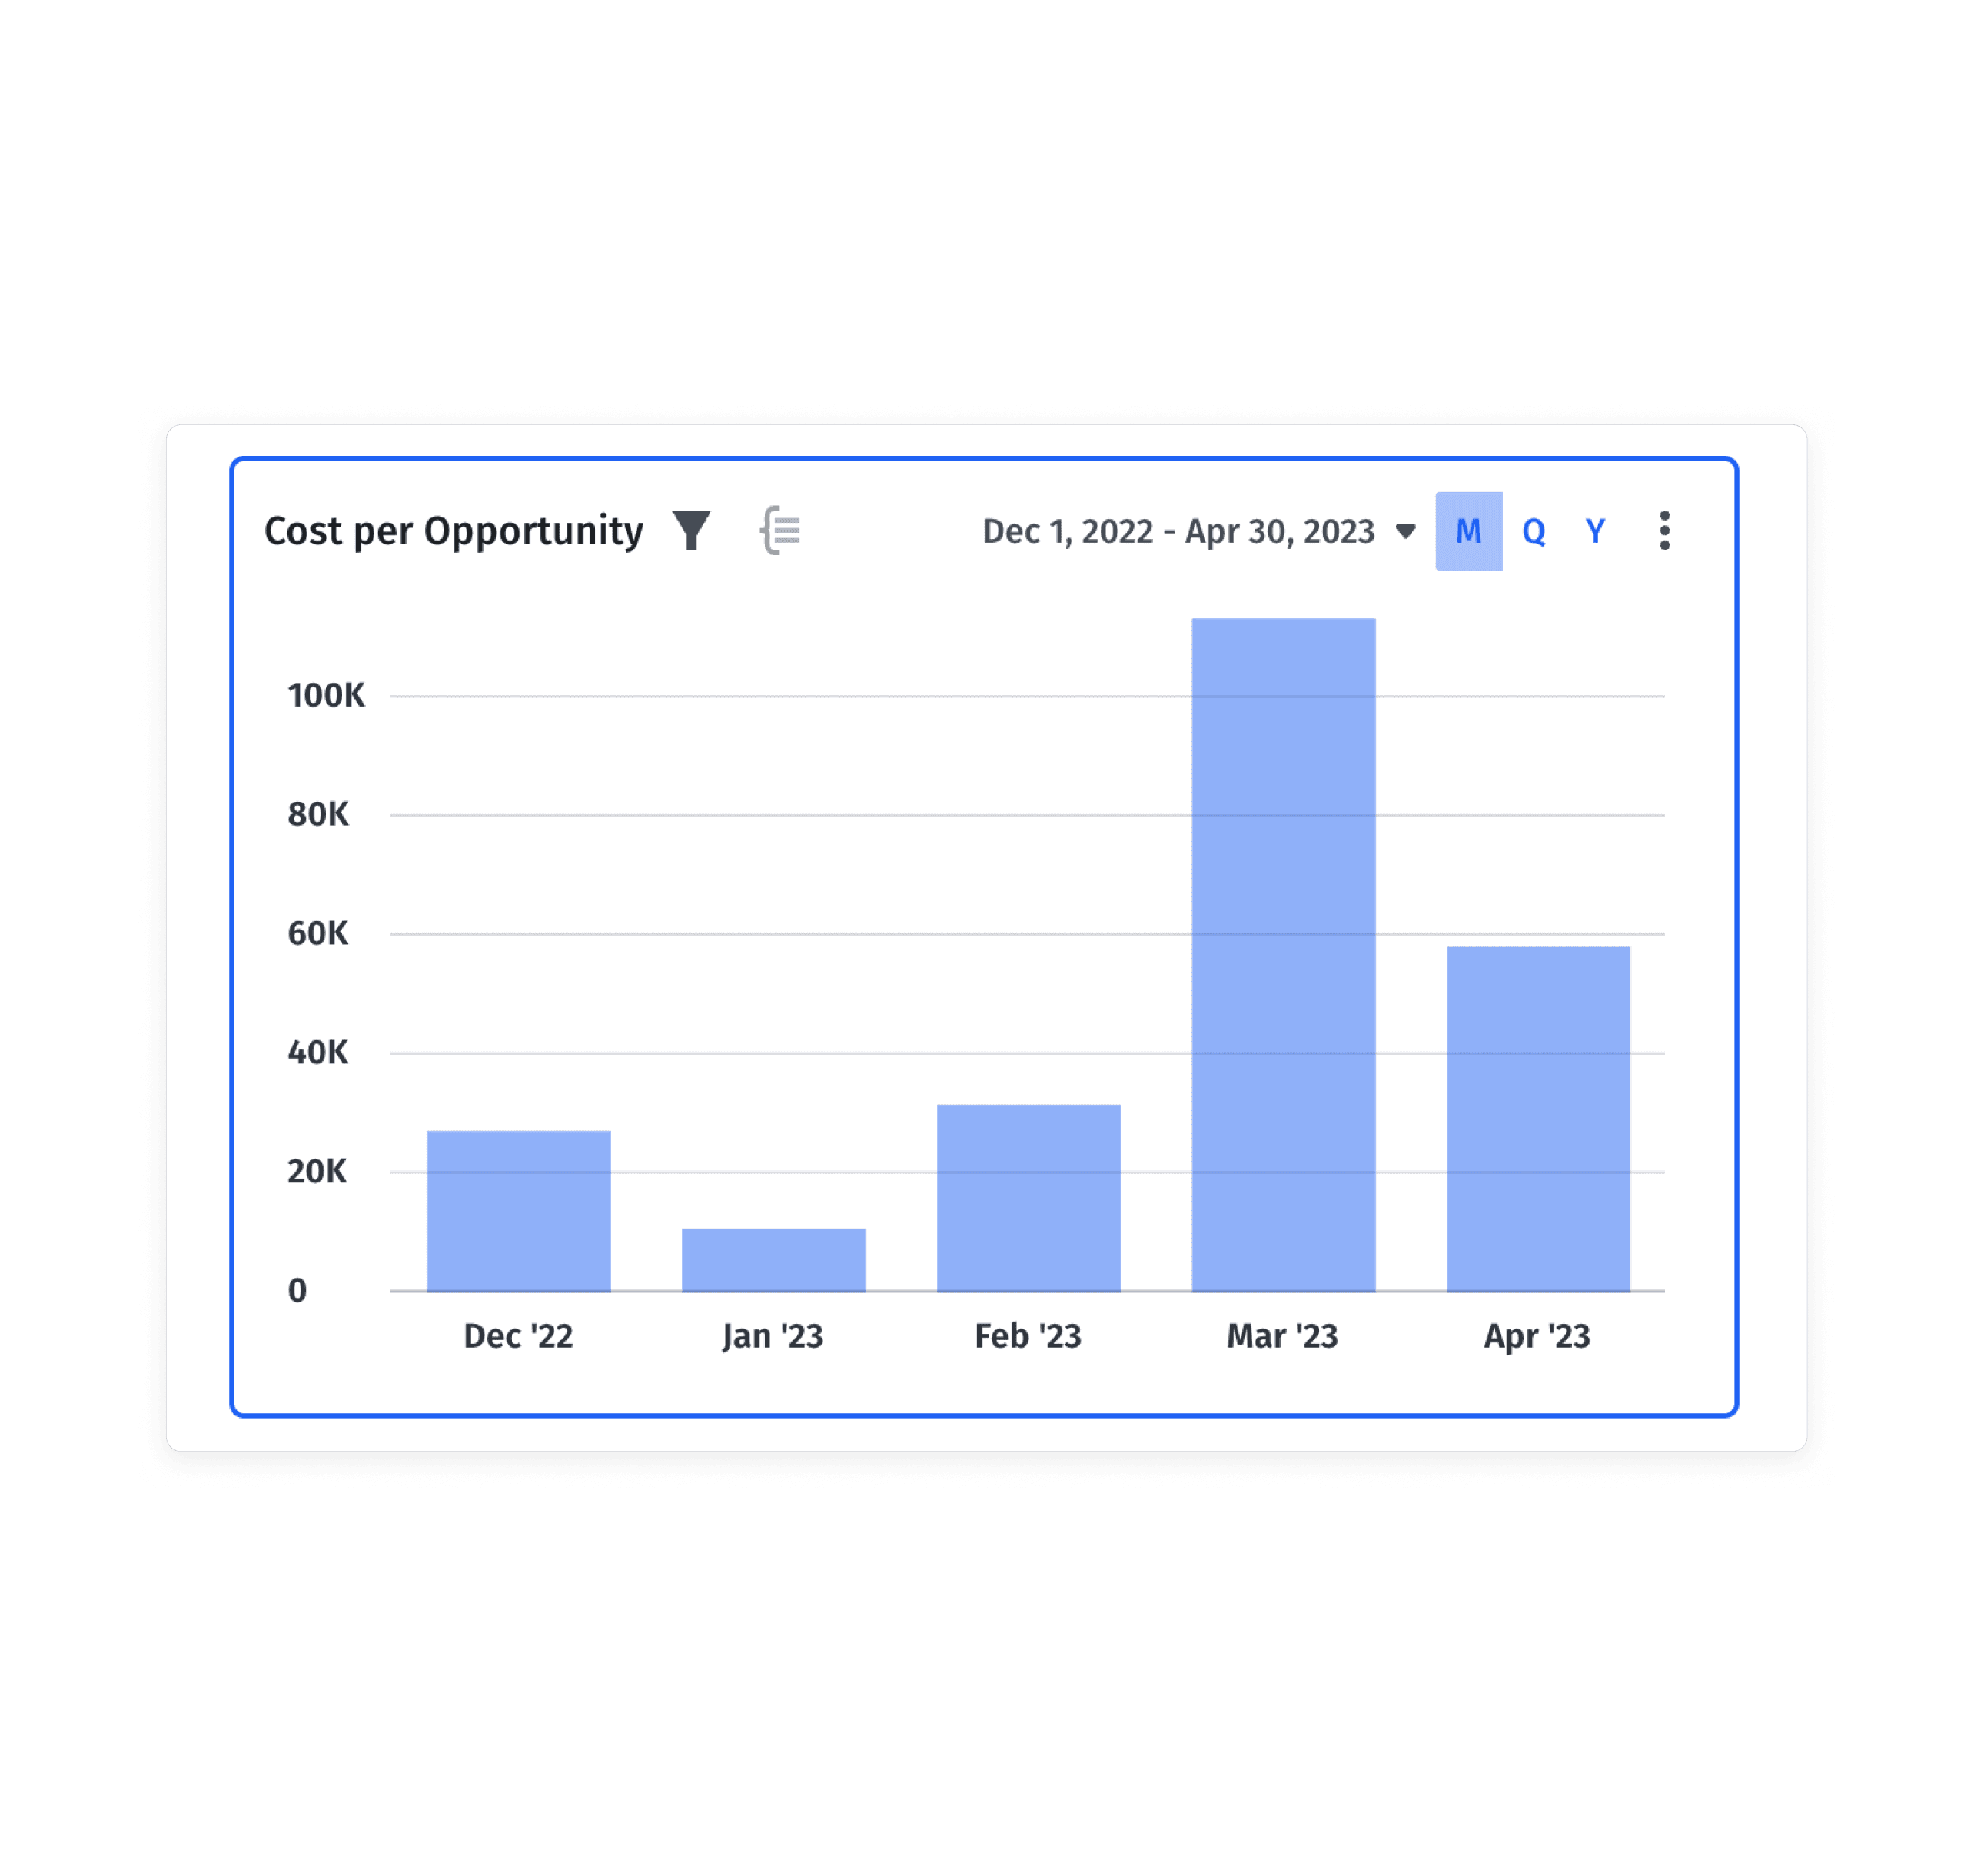
With a tool like Mosaic, you can view your opportunities by cohorts according to how you’ve set up your sales cycle and the percent conversion rate at each stage.
Cost Per Opportunity Formula & Calculator
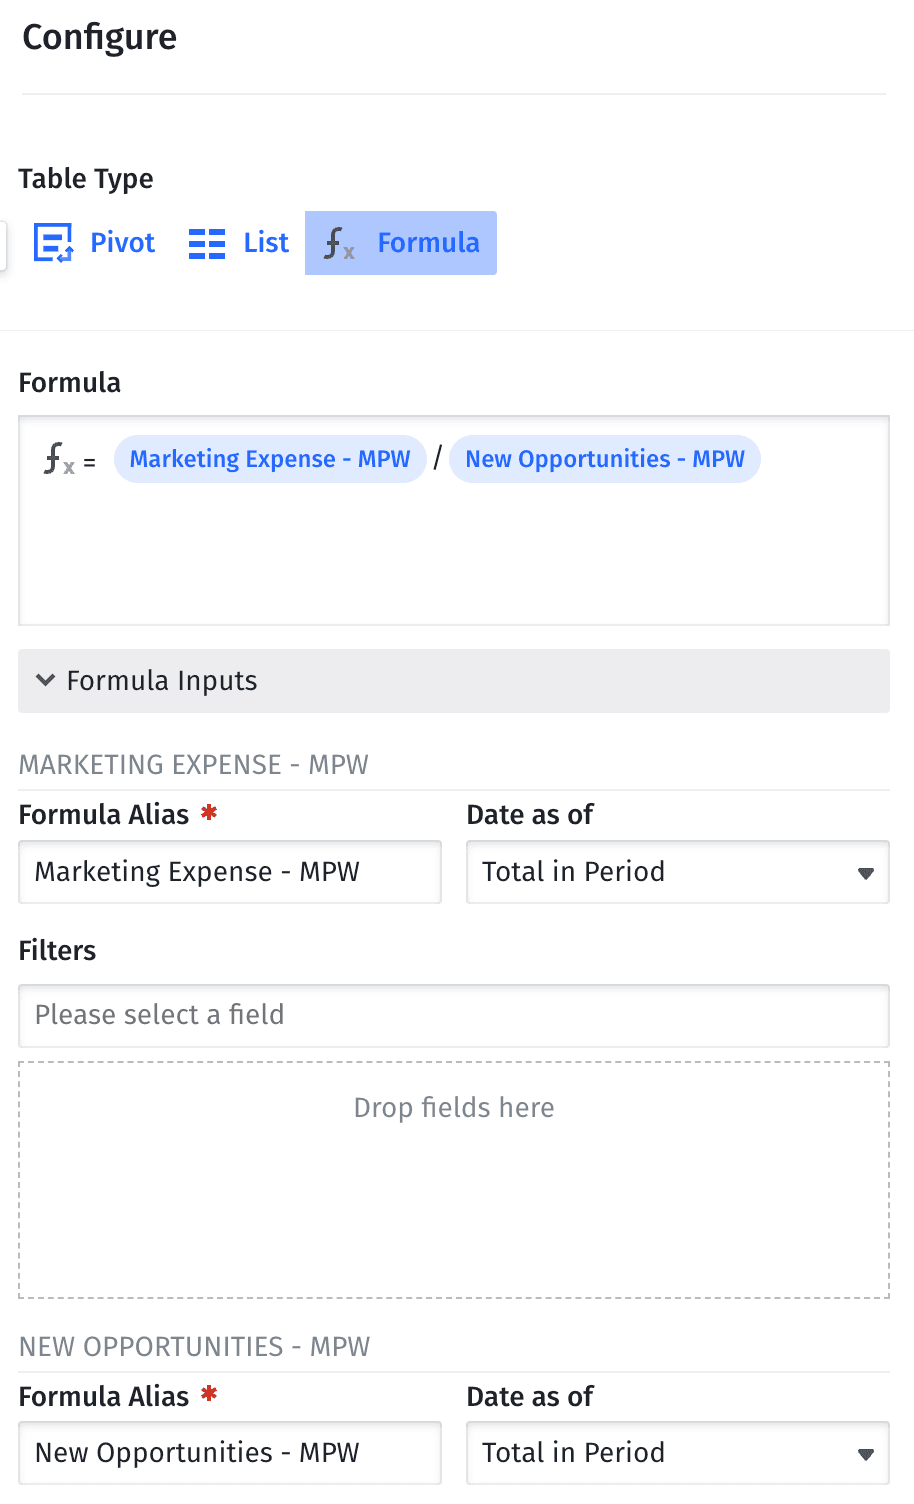
To calculate CPO for your marketing efforts, you take the total marketing expenses for a given period of time and divide that by the number of opportunities captured during the same timeframe. You can calculate CPO on a channel-by-channel basis or for your marketing function as a whole. On the surface, it’s a relatively simple formula.
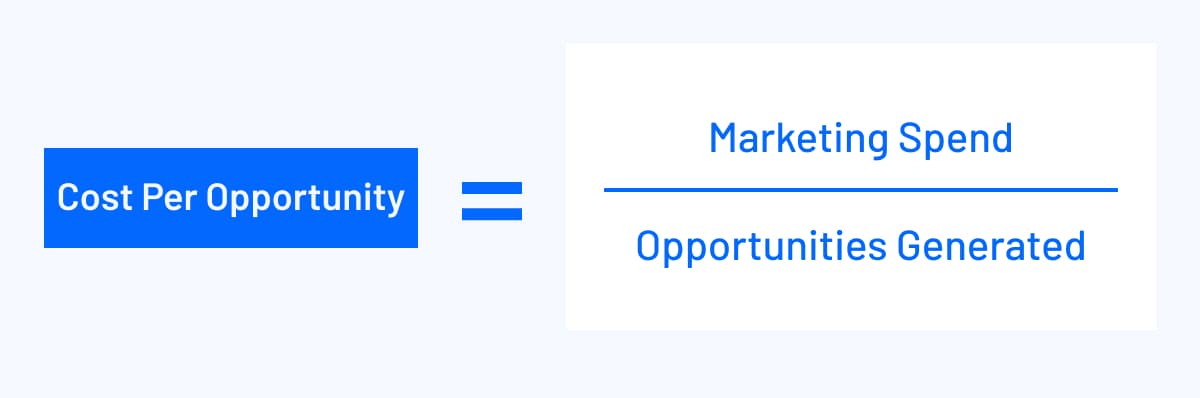
For example, let’s say your SaaS startup spends $250,000 on marketing campaigns and activities in Q2. During this timeframe, you secure 200 opportunities, or qualified leads.
$250,000 / 200 opportunities = $1,250 per opportunity

Cost Per Opportunity Calculator
Your cost per opportunity
$0
What To Include in Sales & Marketing Costs
If you want to calculate your CPO for your business as a whole, you’ll need to include all spend related to the generation of new business opportunities through sales and marketing efforts. Some common costs include:
- Sales and marketing team salaries, commissions, and benefits (and a percentage of these for any executive involved in driving opps)
- Marketing agency or consultancy fees
- Advertising spend, including Google Ads, Facebook Ads, etc.
- Software subscriptions related to sales and marketing efforts, including CRM tools, email marketing platforms, etc.
- Trade shows and event participation fees
- Sponsorship fees
- Lead generation and sales enablement materials such as brochures or swag
- Expenses accrued during sales-and-marketing-related travel

What Is a Good CPO Benchmark?
Generally speaking, the lower your average cost per opportunity, the better. But what exactly constitutes a healthy CPO depends heavily upon your specific industry and the value of each customer you bring in.
If you want to set a good CPO goal for your business, start by comparing your CPO to your annual contract value (ACV) or customer lifetime value (assuming you have enough historical data to have an accurate picture of LTV) and then look at opportunity close rate benchmarks for your industry.
The easiest way to think about this is in terms of ad spend in marketing. You’ll use CPO to gauge the efficiency of your campaigns and determine how much you should spend on ads in the future by comparing the cost per opp to ACV or LTV.
Let’s say, for example, the ACV for your SaaS business is $25,000. If your average deal conversion rate is 25%, then you’d need to drive $100,000 in pipeline (or four opportunities) to generate one deal.
In the absolute worst case, where you’re focused on growth at all costs, you would want a 1:1 ratio of cost per closed-won deal to ACV. In that case, your CPO could be as high as $6,250 for your ad spend (that’s $6,250 x 4 opportunities to generate $100,000 in pipeline and $25,000 in closed-won revenue). You might accept that ratio because you know your LTV is at least 2 years, so you expect to pay off the marketing spend in the long run.
But in tougher market conditions where you have to strike a better balance between profitability and growth, you should aim for at least a 3x return on CPO. In the example above, that would mean spending ~$2,100 per opportunity, so your total costs would be ~$8,400 to generate one $25,000 deal.
How you choose to push the limits of CPO will depend on your appetite for risk and your current approach to balancing growth and efficiency.
How CPO Helps Finance Teams Make Better Decisions
Overall CPO is useful for evaluating the ROI of marketing and sales from a high level, but the bigger value for finance teams often comes from assessing CPO by individual channel. Using a tool like Mosaic, you can access channel-by-channel cost per opportunity in a matter of minutes.
Unlocking more granular CPO data helps finance teams make better business decisions — it can inform budget allocation, improve scenario planning, and streamline cross-team collaboration.
Inform Budget Allocation
Looking at channel-by-channel CPO can help finance teams identify which marketing channels are driving the highest pipeline ROI the most efficiently. For example, you might find that while paid social has driven some closed-won deals, the cost per opportunity is 4x more than it is for PPC. This understanding can fuel more informed discussions between finance and marketing around how to split budget dollars between PPC and paid social channels.
Improve Scenario Planning
CPO is helpful for establishing a baseline for scenario planning. Once you have your channel-level CPO, you can ask very specific what-if questions, such as “What if we doubled our ad spend?” or “What if we turned off paid social media ads and reallocated that budget to PPC?” Comparing projections to accurate baselines empowers decision-makers to improve strategy moving forward.
Facilitate Cross-Functional Collaboration
CPO is one of those universally relevant metrics that help finance, marketing, and executive teams speak the same language. CPO gives everyone a better baseline understanding of return on marketing spend compared to ACV or LTV.
Marketing teams are often better able to explain the narrative around their decision-making and marketing strategies when it’s rooted in CPO and pipeline ROI. Finance teams and business owners can look at CPO alongside other sales and marketing metrics to better understand the efficiency and effectiveness of the go-to-market team in generating, qualifying, and closing new business.
Easily Analyze Cost Per Lead With Mosaic’s Metric Builder
Using Mosaic’s Metric Builder, you can not only access your overall cost per opportunity, but you can customize your calculation by channel, customer cohort, or any other segmentation you require. You can get as granular as you like without spending copious amounts of time adjusting formulas in complex spreadsheets.
Mosaic automatically aggregates data from your CRM and ERP, so you can visualize and understand a wide variety of financial metrics and KPIs based on the most current data and numbers. And Metric Builder enables you to create your own highly-specific metrics via user-friendly no-code UI.
Reach out for a personalized demo to see Metric Builder in action and find out how Mosaic can help you analyze the metrics that matter most to your business, including cost per opportunity.
Cost Per Opportunity FAQs
What is the difference between CPL and CPO?
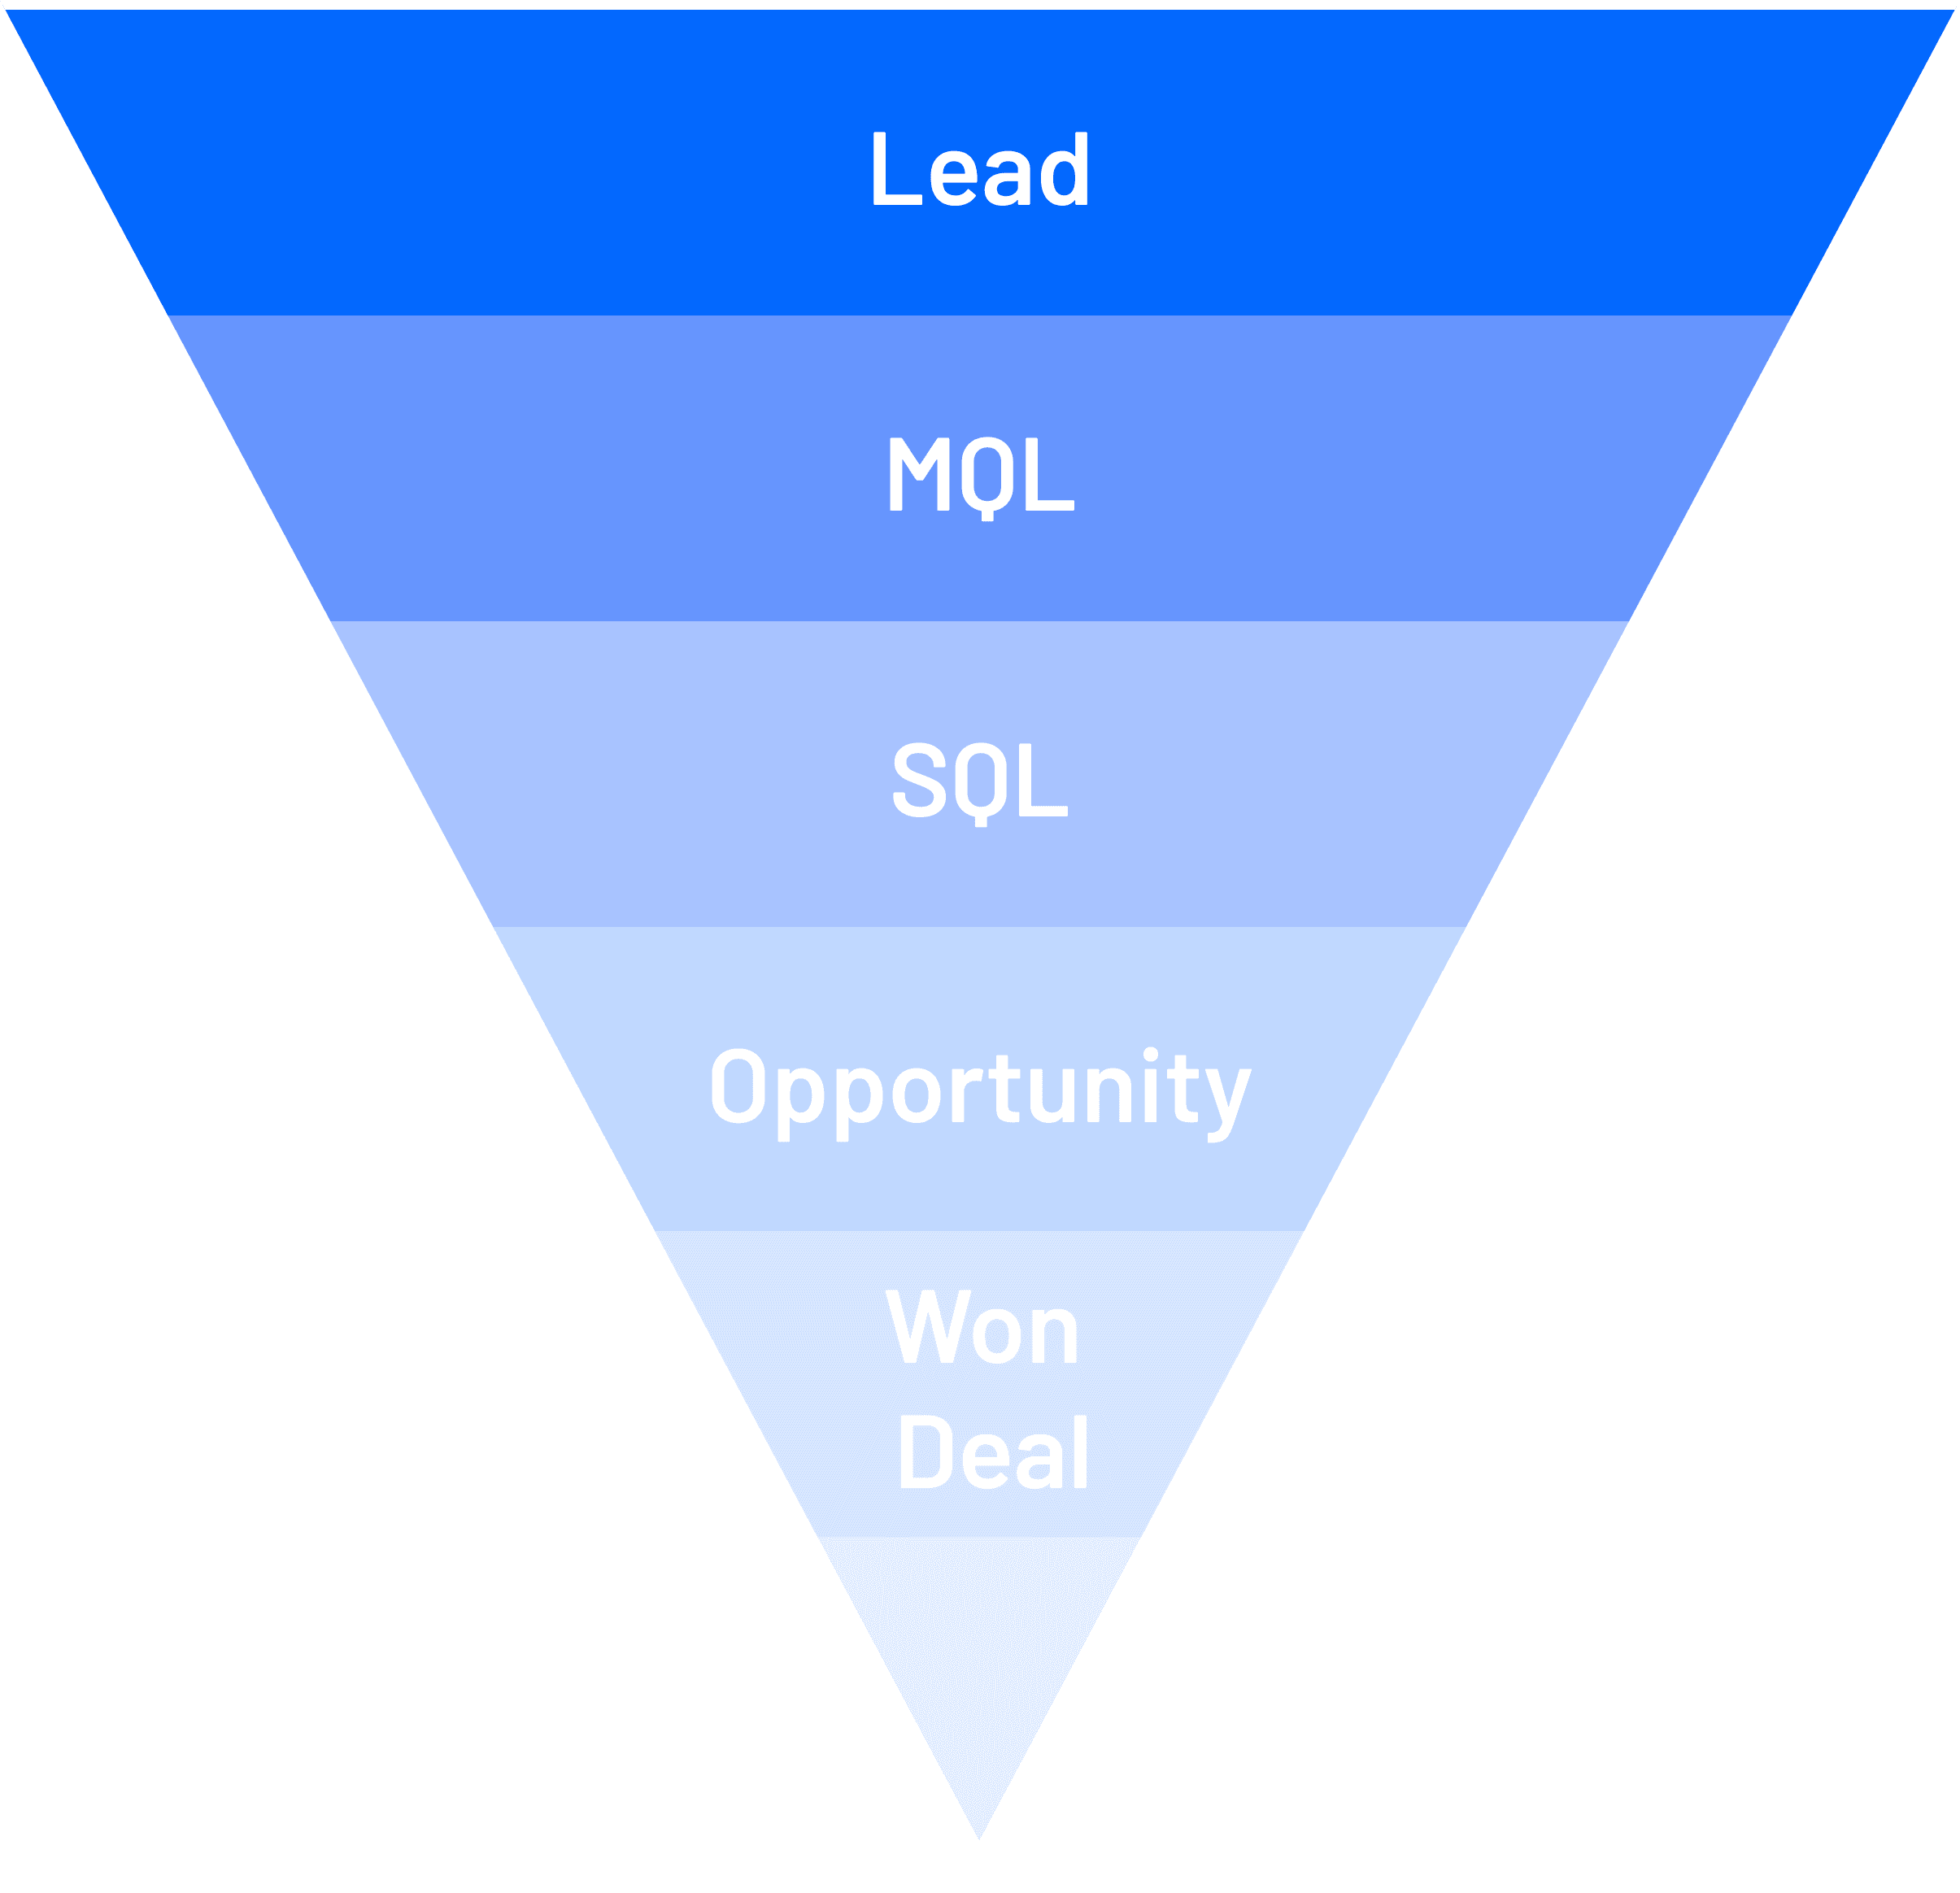
To understand the difference between cost per lead and cost per opportunity, we need to consider the sales funnel. A lead is the least qualified type of potential customer. Leads might be a form submission from a website or the start of a free trial. Opportunities, on the other hand, are highly qualified and have already passed through the MQL and SQL stages of the sales and marketing funnel.
Your CPL will be significantly lower than your CPO because not all leads will become opportunities.
What is the difference between cost per opportunity and opportunity cost?
Explore Related Metrics


Own the of your business.
