R&D Payback Ratio
What is R&D Payback Ratio?
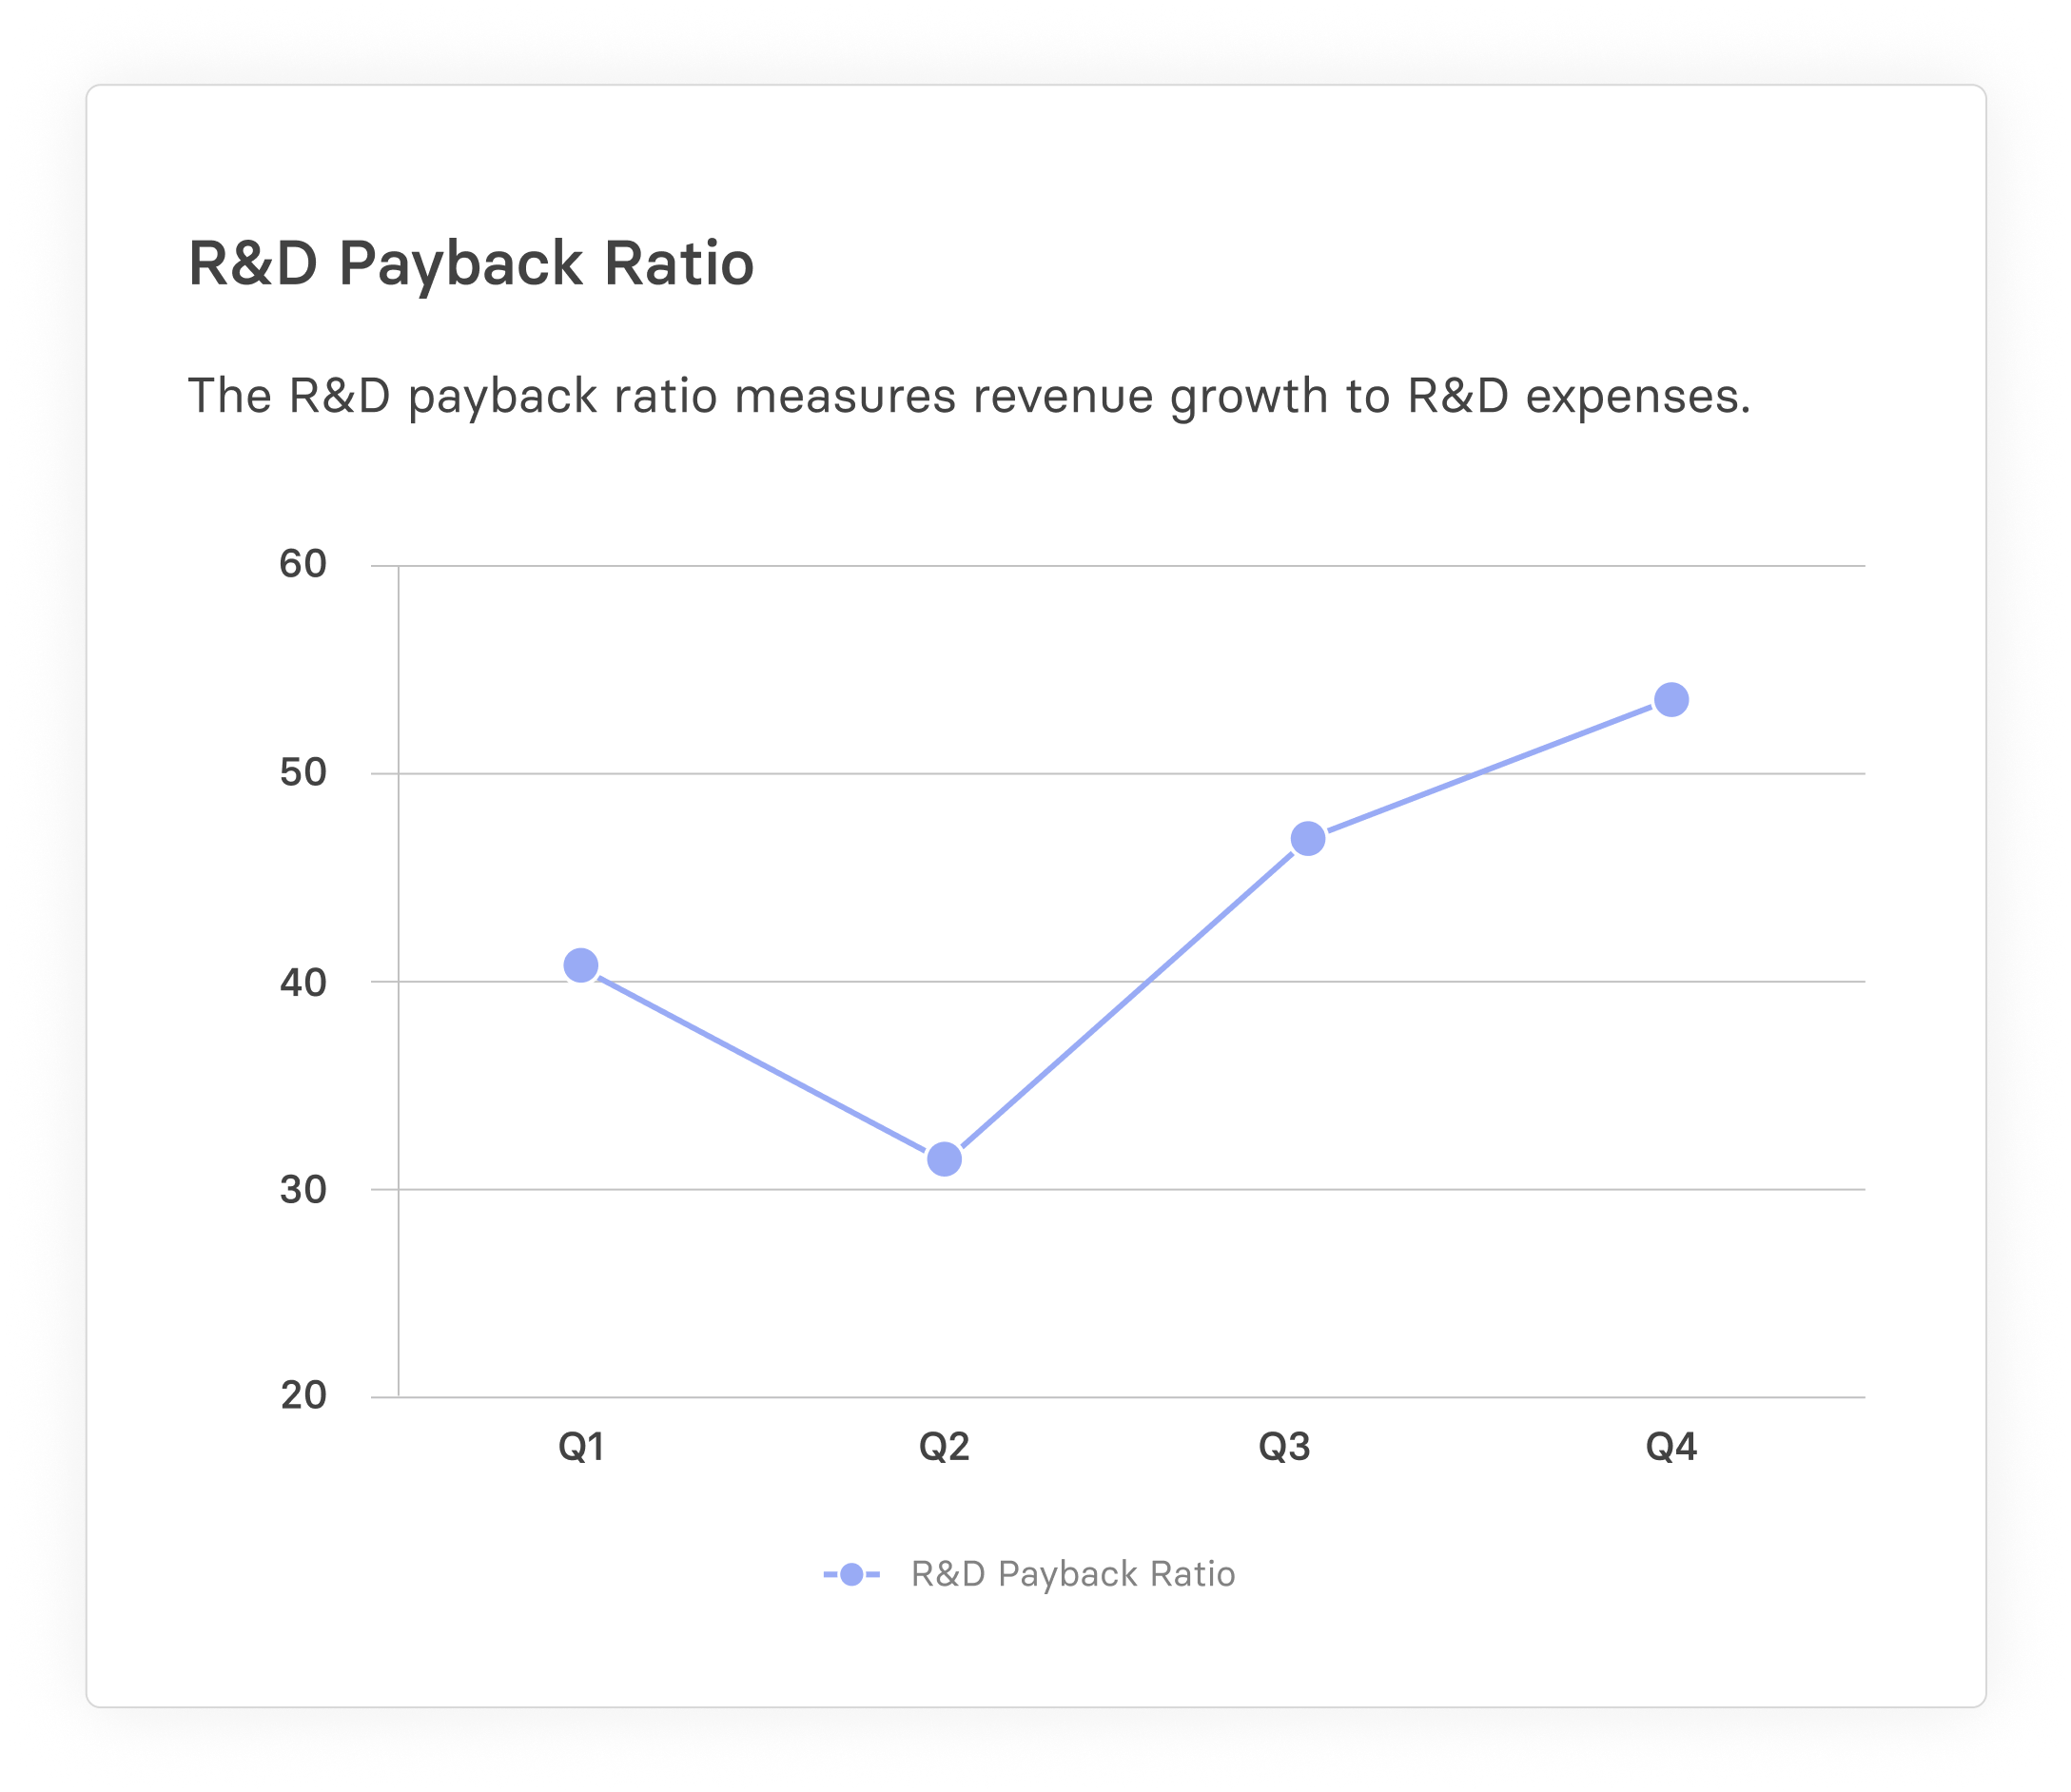
The R&D payback ratio is the increase in revenue from new products for every dollar spent on research and development of those products. This is a particularly relevant SaaS financial metric, given that SaaS companies need to see how the implementation of their product roadmap is helping to grow revenue.
In many ways, it’s a more focused version of broader capital efficiency metrics such as the burn multiple or cash conversion score. Where these metrics aim to assess the overall return for every dollar invested in or spent by the company, the R&D payback ratio narrows this down to purely product development spend.
As such, it doesn’t account for other parts of the business plan that might be driving increases or decreases in revenue, such as sales and marketing. Because of these limitations, like all financial metrics, it’s important to use it as just one data point of many for thorough financial analysis.
Categories
Table of Contents
The Strategic Importance of R&D Payback Ratio for SaaS Businesses
The R&D payback ratio is a valuable metric in strategic decision making for SaaS companies. At a broad level, it can help gauge the effectiveness of the overall product roadmap on company growth, and at a focused level, it can help estimate the time it will take to recoup development costs on a new product.
Making Informed Investment Decisions
The ratio can be a bit of a blunt instrument without context or fine detail. It can be somewhat useful on a company-wide basis, but to really help guide R&D investment decisions it needs to be granular. It’s only then that it can help executives make strategic decisions that maximize R&D payback.
For example, you could have developed two new product lines, one of which is adding significant value to the bottom line, and the other which is having no impact. Overall, that might give you a fairly modest payback ratio, but further analysis can make it clearer to decision makers on where they need to be directing that R&D budget or focusing their sales and marketing teams.
Mosaic’s Metric Builder is a very useful tool to use here, allowing users to calculate R&D payback in a multitude of different ways, segmenting by product line, customer segments and more.
Metric Builder can also be used to calculate how many months it will take to recoup R&D spend on a specific product, offering an alternative take on the traditional R&D payback formula. We’ll show you just how to do that later in this article.
Balancing Innovation and Profitability
At the center of all of this is the need for balance. Development of new features and technology is important, but there needs to be a solid commercial case for the expenditure. After all, if a company can grow revenue and hit targets without the need to spend any money on R&D, then that’s the ideal scenario. Unfortunately, it’s also not very realistic.
In practice, it’s about finding the ‘minimum effective dose’ of R&D spend that allows for consistent long-term revenue growth without wasting cash. Mosaic helps you find that sweet spot but also gives users the ability to then forecast future performance based on it. This can be beneficial when you want to see the long-term effects of R&D investments or decide which products to focus on.
The Basics of R&D Payback Ratio
As we’ve mentioned, the R&D payback ratio calculates the effective return on investment on R&D spend, by calculating how many dollars in revenue have been generated by new products launched on the back of new R&D expenditure.
The traditional way to calculate the R&D payback ratio uses a formula that looks like this:

R&D Payback Ratio Example
Imagine you’re a SaaS startup offering a crm/patient data platform to vet clinics and hospitals. Last year you spent $350,000 on R&D developing a direct integration with livestock auction houses. Since launching the new service, you’ve generated $500,000 in new revenue from it.
$500,000/$350,000 = $1.43
So for every $1 spent on R&D, you’ve increased revenue by $1.43.
Pro Tip: Make sure to segment your sales by product line in your CRM and ERP system to make sure you can properly allocate
Interpreting Your Results
Obviously this looks like it’s off to a good start as the investment you’ve made in product development have contributed 1.4x back in new sales. The results can’t be taken at face value, however, as there are a lot more variables that need to be assessed to confirm that the R&D expenditure is money well spent.
Retention rates of these new customers will be important, as the new revenue won’t add long term value to the company if net retention is low and customers are churning right back out of the product.
We also need to ensure that the sales team are going to be able to consistently replicate these numbers over time and continue to efficiently sell the product, with the SaaS magic number being a good way to assess this. It will also be necessary to measure the LTV/CAC ratio to assess the profitability of the new customers and ensure the figures align with strategic forecasts.
This is easy to do with Mosaic, with the ability to compare multiple operational metrics all in one place. We also take a slightly different approach to the R&D payback metric, which is more tailored to SaaS companies. Below, we’ve created a step- by- step guide which explains how this works.
What Is a Good R&D Payback Ratio?
According to Lauren Kelly, CEO of OPEXEngine, broadly speaking, a good R&D payback ratio for a SaaS company would be a figure above $2. As with anything, there is a huge amount of variability across market segments and different company sizes.
As a company scales, it becomes more difficult to maintain or improve the ratio — as the software becomes more mature and as there’s less ‘low hanging fruit’ to move the needle on revenue.
R&D Payback Ratio vs. Other SaaS Metrics
As mentioned earlier, the R&D payback ratio shouldn’t be considered in isolation. As the saying goes, correlation doesn’t equal causation. In other words, just because revenue has gone up with higher R&D expenditure, doesn’t necessarily mean that the new product development is the reason for the increase
This is where looking at the R&D payback ratio in conjunction with other metrics such as the SaaS Magic Number and the LTV/CAC ratio can help build a more comprehensive picture of how sales growth is being achieved.
In short, teams need to analyze a wide variety of financial metrics to assess the overall performance of the company. This is specifically why we created the Mosaic Metric Builder, which allows almost unlimited customization on metrics across everything from cost per lead, to customer retention rates to, yes, R&D payback.
Not only can users see just about any metric they can think of, but these can all be split and categorized by business unit, product line, geographic areas, and many more variables
Step-By-Step Guide To Using Mosaic’s Metric Builder
For SaaS companies, there’s value in a slightly different approach to R&D payback for two key reasons:
- SaaS companies are heavily focused on product development, and
- usually funded through capital, not cash flow. Especially in the early stages.
Because of that, it can be beneficial to look at R&D payback in terms of how quickly R&D investment money can be recouped by new product sales.
The formula we use for this is:
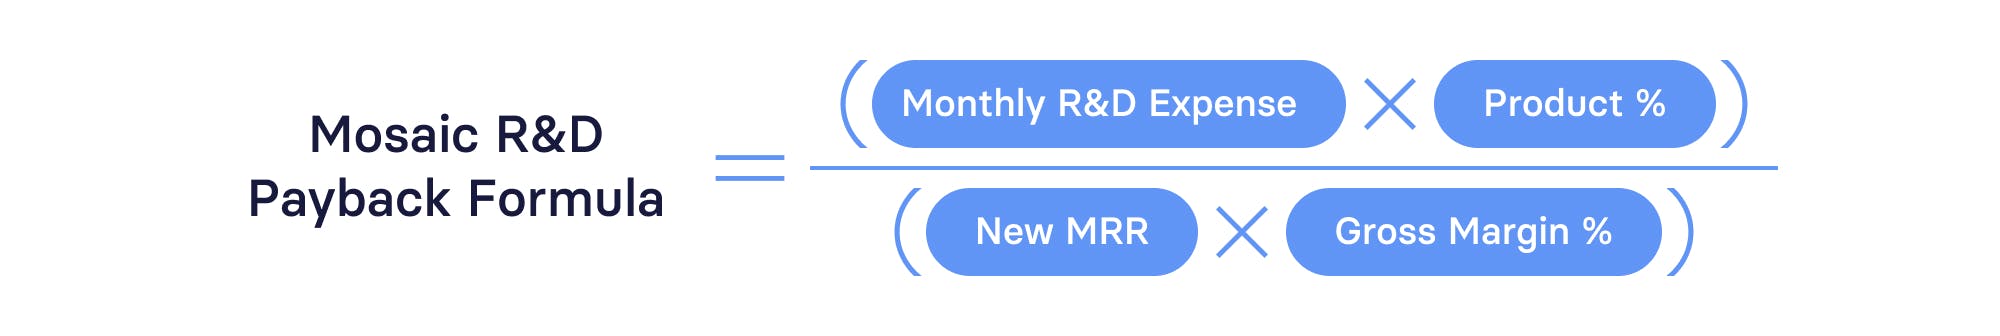
Here’s how to build the R&D payback ratio in Mosaic:
Create a metric for R&D expenses, by building a custom metric that tracks engineering expenses.
- Create a second custom metric (if you don’t have one already) for the New MRR you want to track, being sure to add a filter that carves out just the new product you want to analyze (e.g. Auction House Customers from our earlier vet CRM example).
- Go back to Metric Builder to create a third new metric (all of these can be built in just one or two minutes), this time called R&D Payback, adding the formula from above into the formula tab. The Product % component is the amount of your overall R&D expenses which have been used to build the selected product.
- Open the P&L Analysis Canvas, where you can add the newly created R&D payback metric.
Once this is done, you can see how long it will take to recoup R&D costs incurred in each month.
This is an incredibly useful tool to help guide discussions on sales and marketing efforts and engineering spend. More of a visual learner? This 4 minute video walks you through the entire process:
Customizing Analysis With Mosaic
This is only the tip of the iceberg for analyzing R&D expenditure in Mosaic. There are practically unlimited filters that can be applied to the data, allowing you to see the impact of R&D spend not just across product lines, but business units, sales teams, geographic regions, and more.
Not only that, you can also conduct detailed comparative analysis against past periods to assess the impact of changes that have been made to your R&D strategy over time.
Integrating R&D Payback Ratio With Other Metrics in Mosaic
As we’ve mentioned throughout, R&D payback is a valuable metric, but it’s not the only metric. Directly within Mosaic, users can review and compare R&D payback to almost any other metric imaginable.
For example, it can serve as the starting point for scenario models that look at the impact of increasing future R&D expenditure. It could also be used in conjunction with financial health metrics like net profit or days sales outstanding – are the new customers the type of customers you want?
Conclusion: Leveraging R&D Payback Ratio for SaaS Success
As you can see, R&D payback is an underrated tool in assessing the performance of your strategic investment choices. Used in the right way, it can not only provide SaaS companies with a broad view of how successful their product roadmap is performing, but also help guide decisions on which products to launch next.
Combining hard financial data with qualitative customer feedback and requests provide a powerful combination for future development, and more efficient use of resources.
Mosaic offers the ability to not only create custom R&D payback metrics specific to your business, but also to integrate the results with your other financial analyses and projections. To see how Mosaic can transform the way your business utilizes capital and manages cash, book a demo today.
R&D Payback FAQs
How does Mosaic help in calculating and analyzing the R&D payback ratio?
Mosaic allows users to quickly and easily calculate and analyze the R&D payback ratio for the entire company or specific product lines, teams, or geographic areas. This can be done with no coding and a simple drag and drop formula builder.
What constitutes a 'good' R&D payback ratio for a SaaS company?
How can companies use Mosaic to integrate R&D payback ratio with other key metrics?
Explore Related Metrics


Own the of your business.
