Sales Performance Metrics
What Are Sales Performance Metrics?
Sales performance metrics are the KPIs you track to understand the efficiency and effectiveness of your account executives and sales development representatives. These metrics will give you a clear view of three high-level concerns — how your pipeline is growing over time, how well you’re tracking to top-line forecasts, and how efficiently your team is closing deals.
Categories
So much of what makes a great salesperson comes down to intuition. But that doesn’t mean you can base your overarching sales strategy on intuition.
Digging deep into your sales performance metrics will provide data points to help you measure your team’s performance, identify issues in the pipeline, and improve revenue forecasting.
This is why RevOps and finance teams can be such strong strategic partners for sales. If you can surface the right insights to sales leaders and reps, you’ll be able to boost sales productivity and help your company drive toward its growth goals. But your ability to play an active role in the sales process starts with knowing which metrics to track.
Choosing the right sales performance metrics depends on the specifics of your business—your SaaS pricing strategy, your go-to-market plan, and the structure of your sales team. However, the following 14 sales metrics are great ways to evaluate the performance of your individual reps and the team as a whole.

How To Choose Sales Performance Metrics To Track
There are dozens, maybe hundreds of different metrics you can track for your sales team both within your CRM setup and when you combine that data with insights from other systems. But just because you can track so many KPIs doesn’t mean you should.
The best finance and sales leaders can work together to identify and track only the most important sales performance and sales pipeline metrics.
Here are four things to consider when you choose which sales metrics to track:
Choose Sales KPIs Related to Strategic Goals
Key performance indicators (KPIs) are the specific metrics that measure your progress toward a strategic goal. For example, if you had a benchmark of increasing sales qualified leads by 10%, your KPI would be the number of SQLs in the pipeline.
Tailor Metrics to Your Product and Sales Process
Each type of product has different financial forecasting levers. For instance, companies that sell SaaS products with subscription pricing should build revenue forecasts based on annual recurring revenue (ARR), monthly recurring revenue (MRR), and sales capacity planning to measure sales growth.
Start with the Questions You Have About Your Sales Cycle
You can identify the top performers in your sales organization by tracking sales metrics related to individual performance, such as quota attainment, revenue per sales rep, and follow-up success rate.
Match Metrics to Your Performance Goals
Your sales reps will pay attention to the metrics that you monitor. So, you can reinforce performance goals by tracking relevant metrics, helping your team stay focused on key sales activities, and offering incentives to complete goals.
By choosing the right sales metrics, including both leading indicators and lagging indicators of your pipeline’s efficiency and effectiveness, you create a more accurate picture of growth and keep your managers and salespeople focused on high-impact activities.
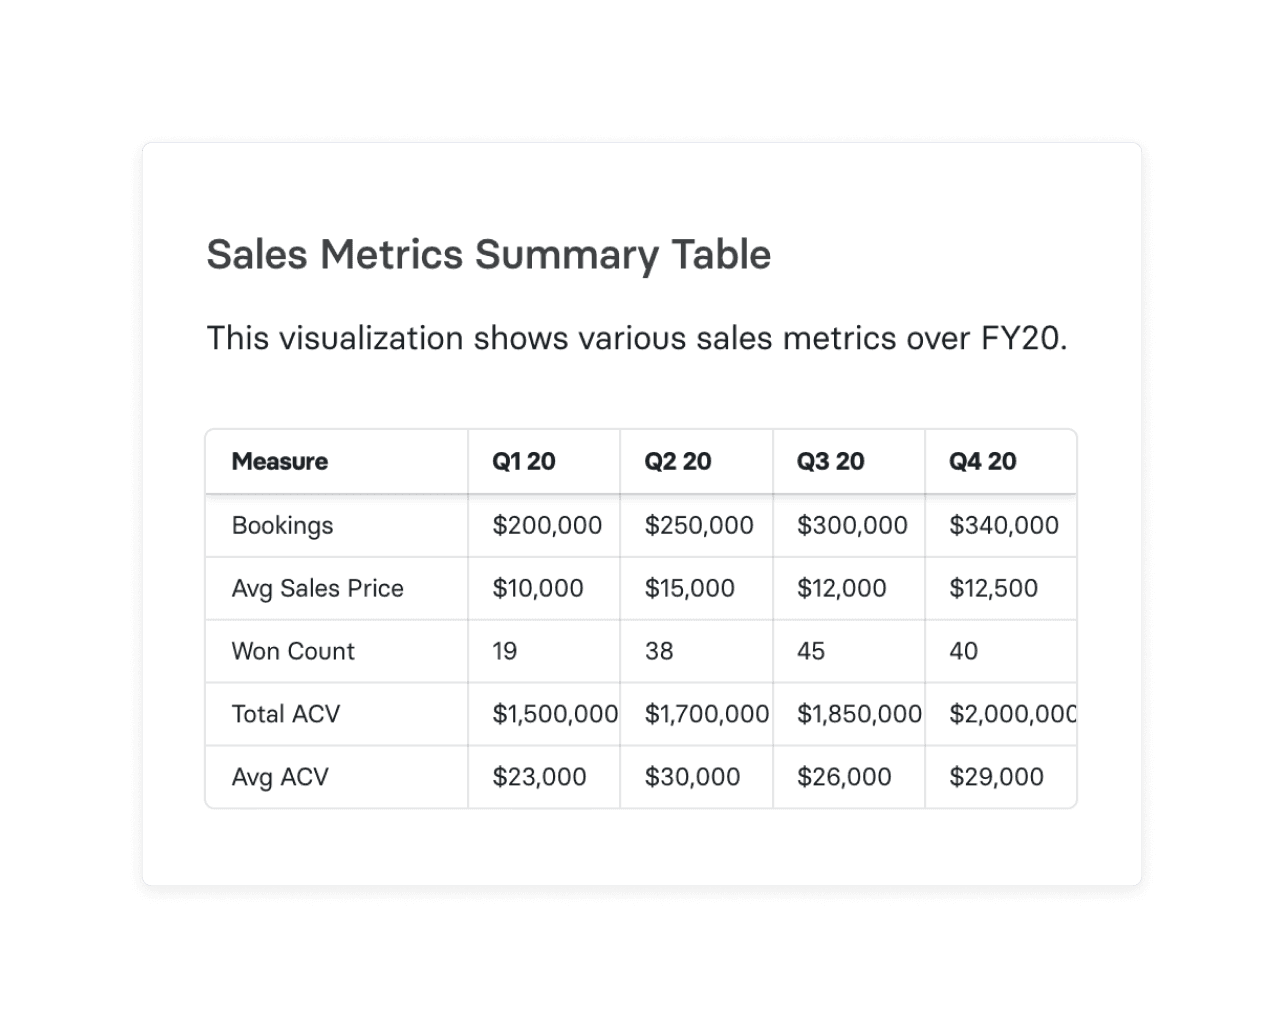
14 Essential Sales Performance Metrics
The right mix of sales metrics depends on several factors, such as your company’s current performance, unique challenges, and product type.
But there are a few standard sales performance metrics used by top SaaS finance and revenue leaders that you should consider:
1. Opportunities Won
Opportunities won measures the number of opportunities in the pipeline that result in a sale or contract signature. You can also interpret opportunities won as the number of new clients you gain each month or quarter.
It’s helpful to compare your actual opportunities won number to your forecasted values to see if there are discrepancies. If you see major differences in projected versus actual values, you can look for issues in the pipeline or your sales forecasting methods.
2. Closed Won/Lost Summary
Measuring the total number of deals won over time only paints a partial picture of sales effectiveness. For more context, you need to look at your closed won/lost summary, which shows the number of deals won and lost over a given period of time.
Not only does this comparison tell you about the effectiveness of your sales process, but it can also provide clues into whether or not you have a solid product/market fit. A high number of deals lost (or a rising trend of deals lost) may mean your product doesn’t solve the right need, your messaging is off, or you’re selling to the wrong customer base.
3. Sales Rep Ramp
Sales rep ramp, also known as sales ramp-up time, helps you track how long it takes for a new hire to reach full productivity by measuring a running total of bookings per rep.
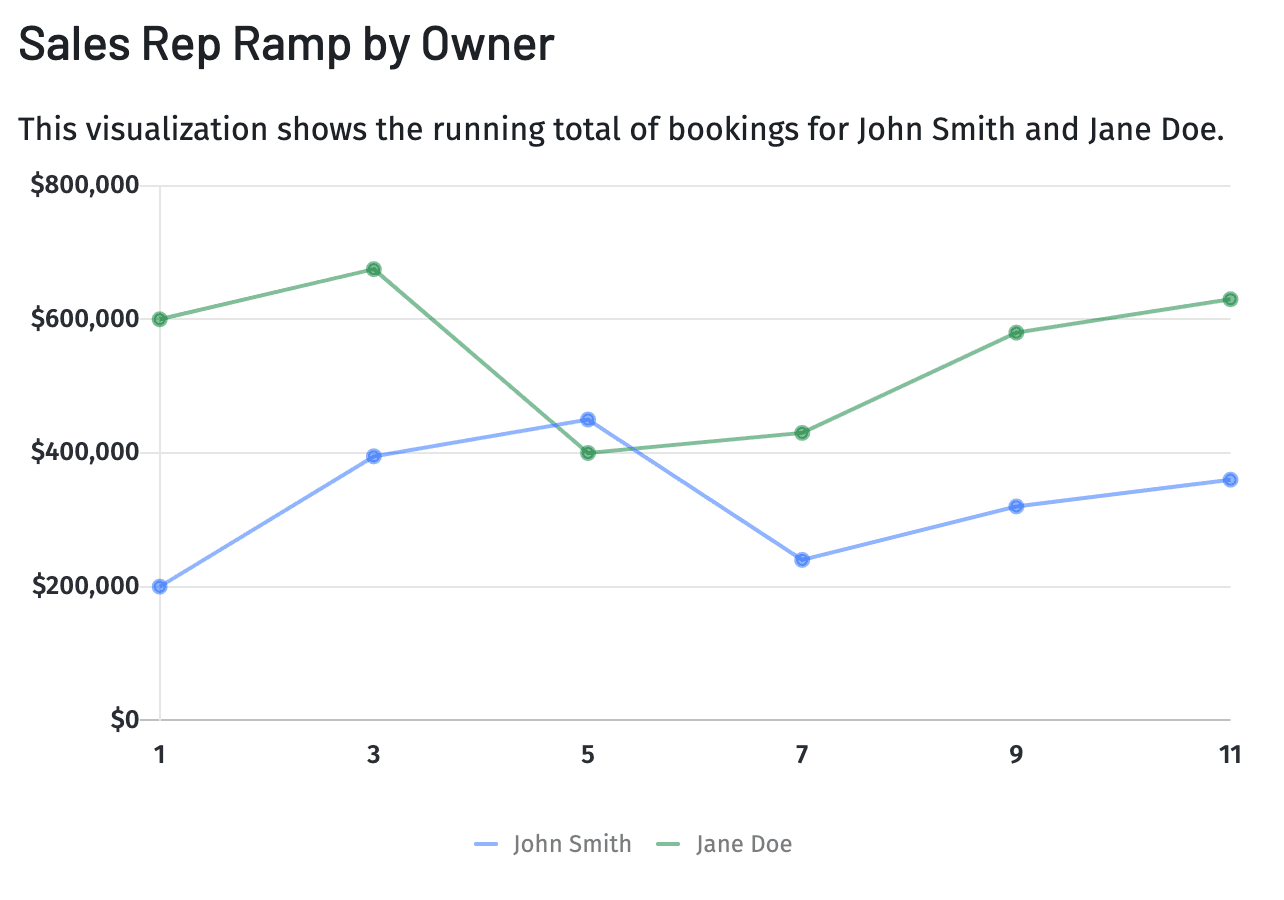
Understanding your average sales ramp-up time frame lets you determine your sales training program’s effectiveness and efficiency. And it also gives you a strong foundation for forecasting revenue based on quota attainment.
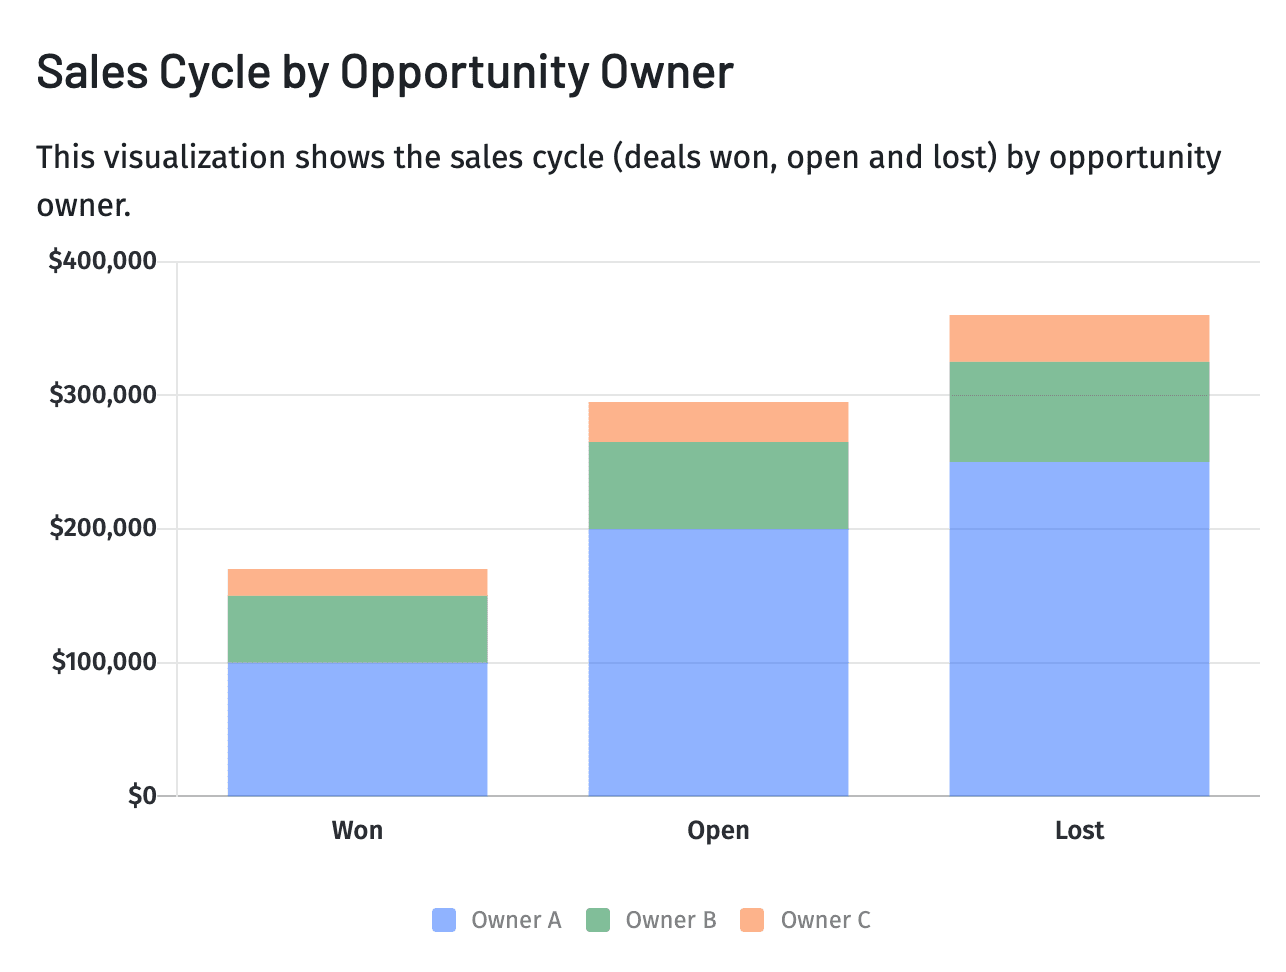
4. Sales Cycle
The sales cycle metric is the average number of days a deal exists from its creation to the close date (or current date). When you look at your CRM or sales dashboard for real-time sales data, you may see this metric labeled as deal age if a deal has yet to close.
Understanding your sales cycle helps you forecast future revenue more accurately. Yet, to fully grasp the overall revenue realization, it’s important to consider days sales outstanding (DSO), which measures the average number of days from making a sale to collecting the payment. A lengthier DSO might delay the actual inflow of cash even if the sales cycle is short. It’s also a helpful real-time metric that sales managers can use when holding pipeline review meetings.
Managers and reps should discuss deals that stay open longer than the average sales cycle to identify obstacles to closing.
5. Deal Conversion Rate
Deal conversion rate measures the percentage of deals that convert into a sale or signed contract. To calculate it, divide the number of deals won by the total number of deals over a given time.
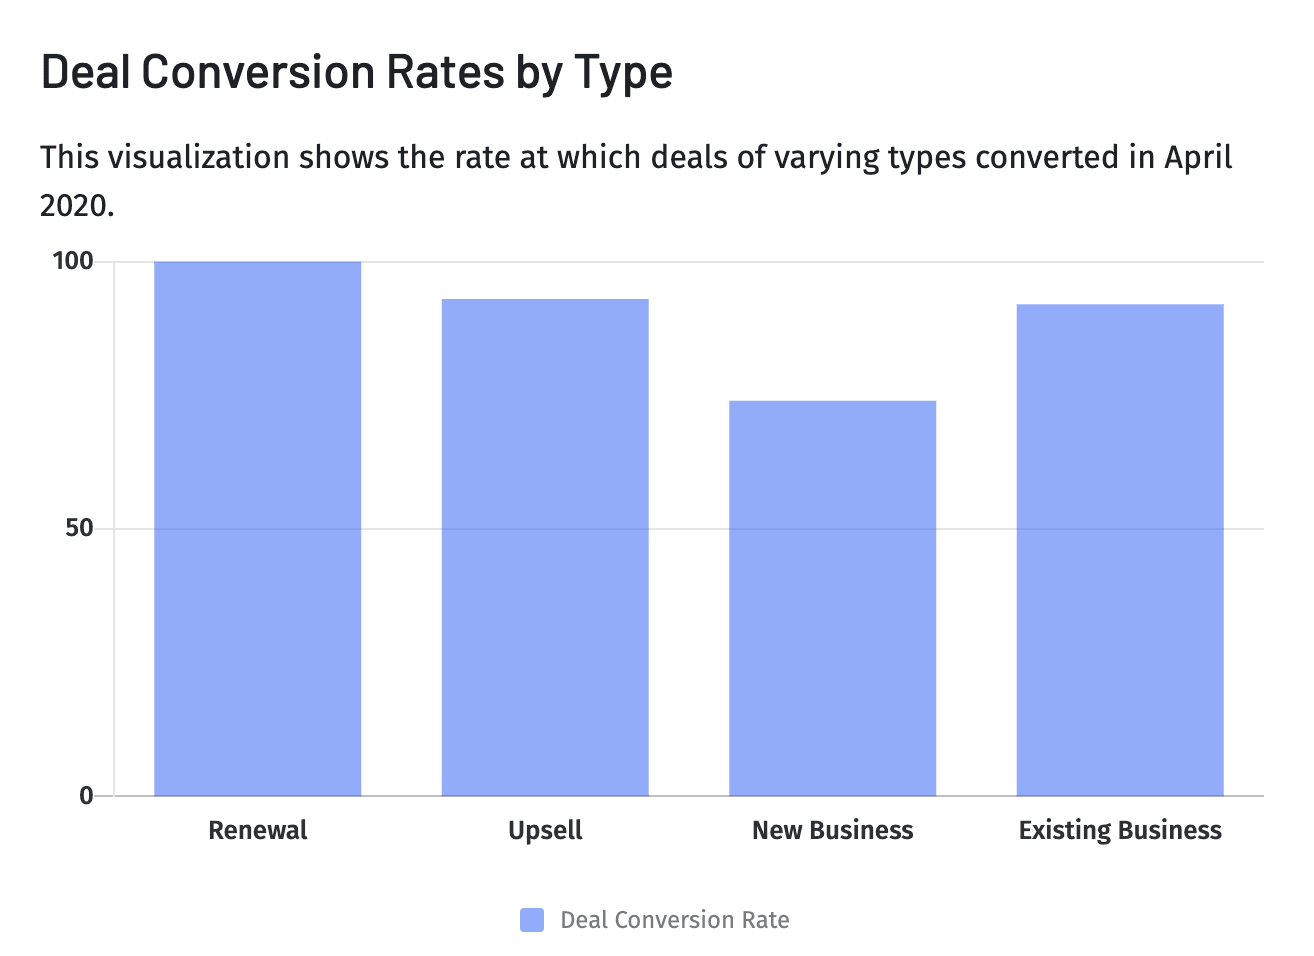
Monitoring deal conversion rates help you analyze the effectiveness of your sales and marketing. You can also compare sales funnel conversion rates and deal conversion rates by type (such as renewal, upsell, or new customer). This helps you understand which sales channels are most effective and where you have opportunities to improve.
6. Opportunities Created
Lead generation is critical for maintaining a healthy sales pipeline and forecasting revenue. Opportunities created is a sales performance metric that measures the number of new sales or deals added to the CRM in a given time.
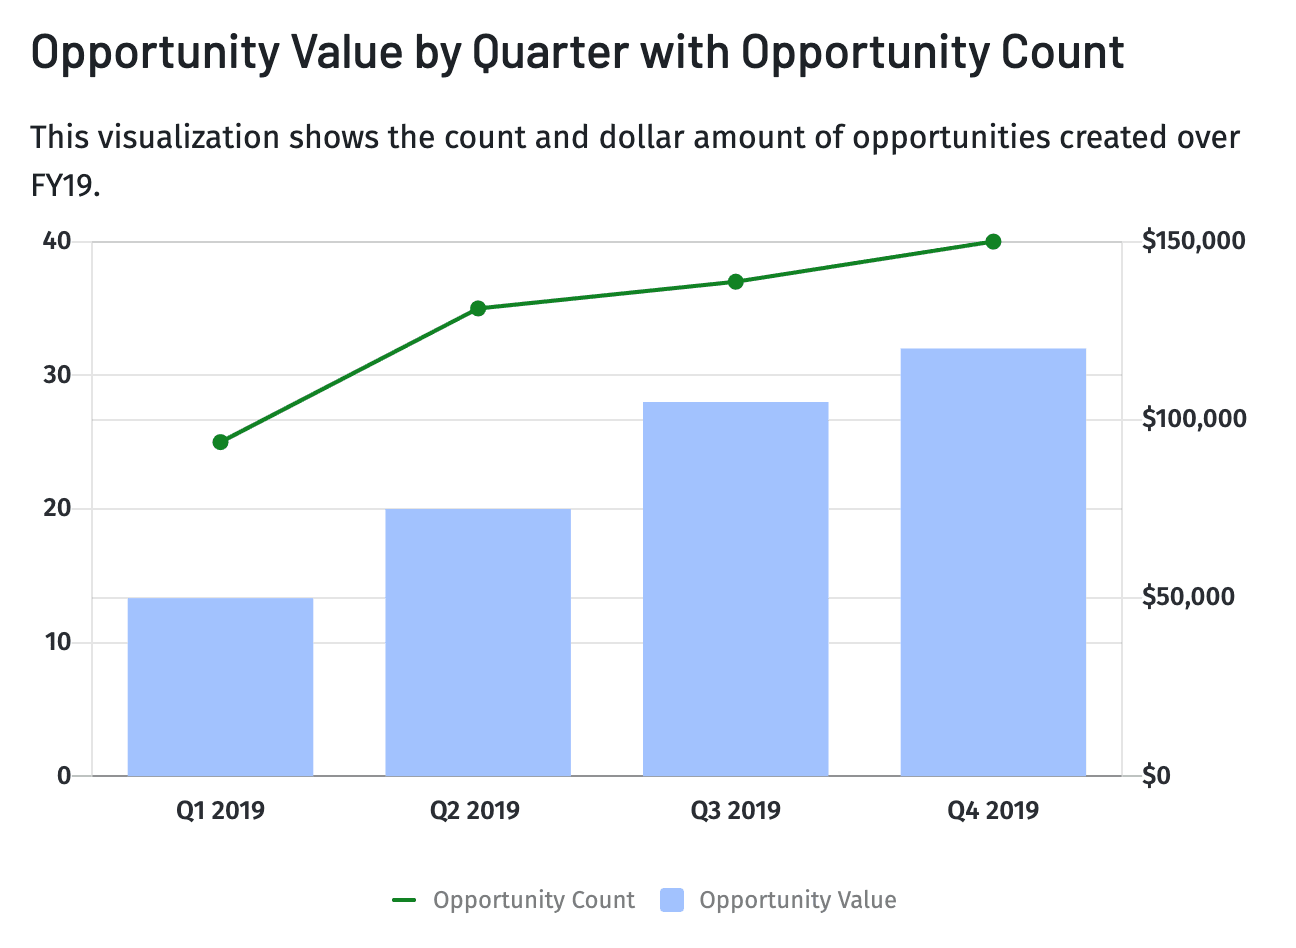
You can look at the total number of sales opportunities created and the value of new opportunities created. Both versions of this metric fuel forecasting and let you track the effectiveness of your marketing and business development efforts.
7. Bookings Up for Renewal
Selling to existing customers is one of the most cost-effective ways to generate revenue. And for SaaS companies, it’s the key to driving up net revenue retention—perhaps the most important indicator of a company’s health.
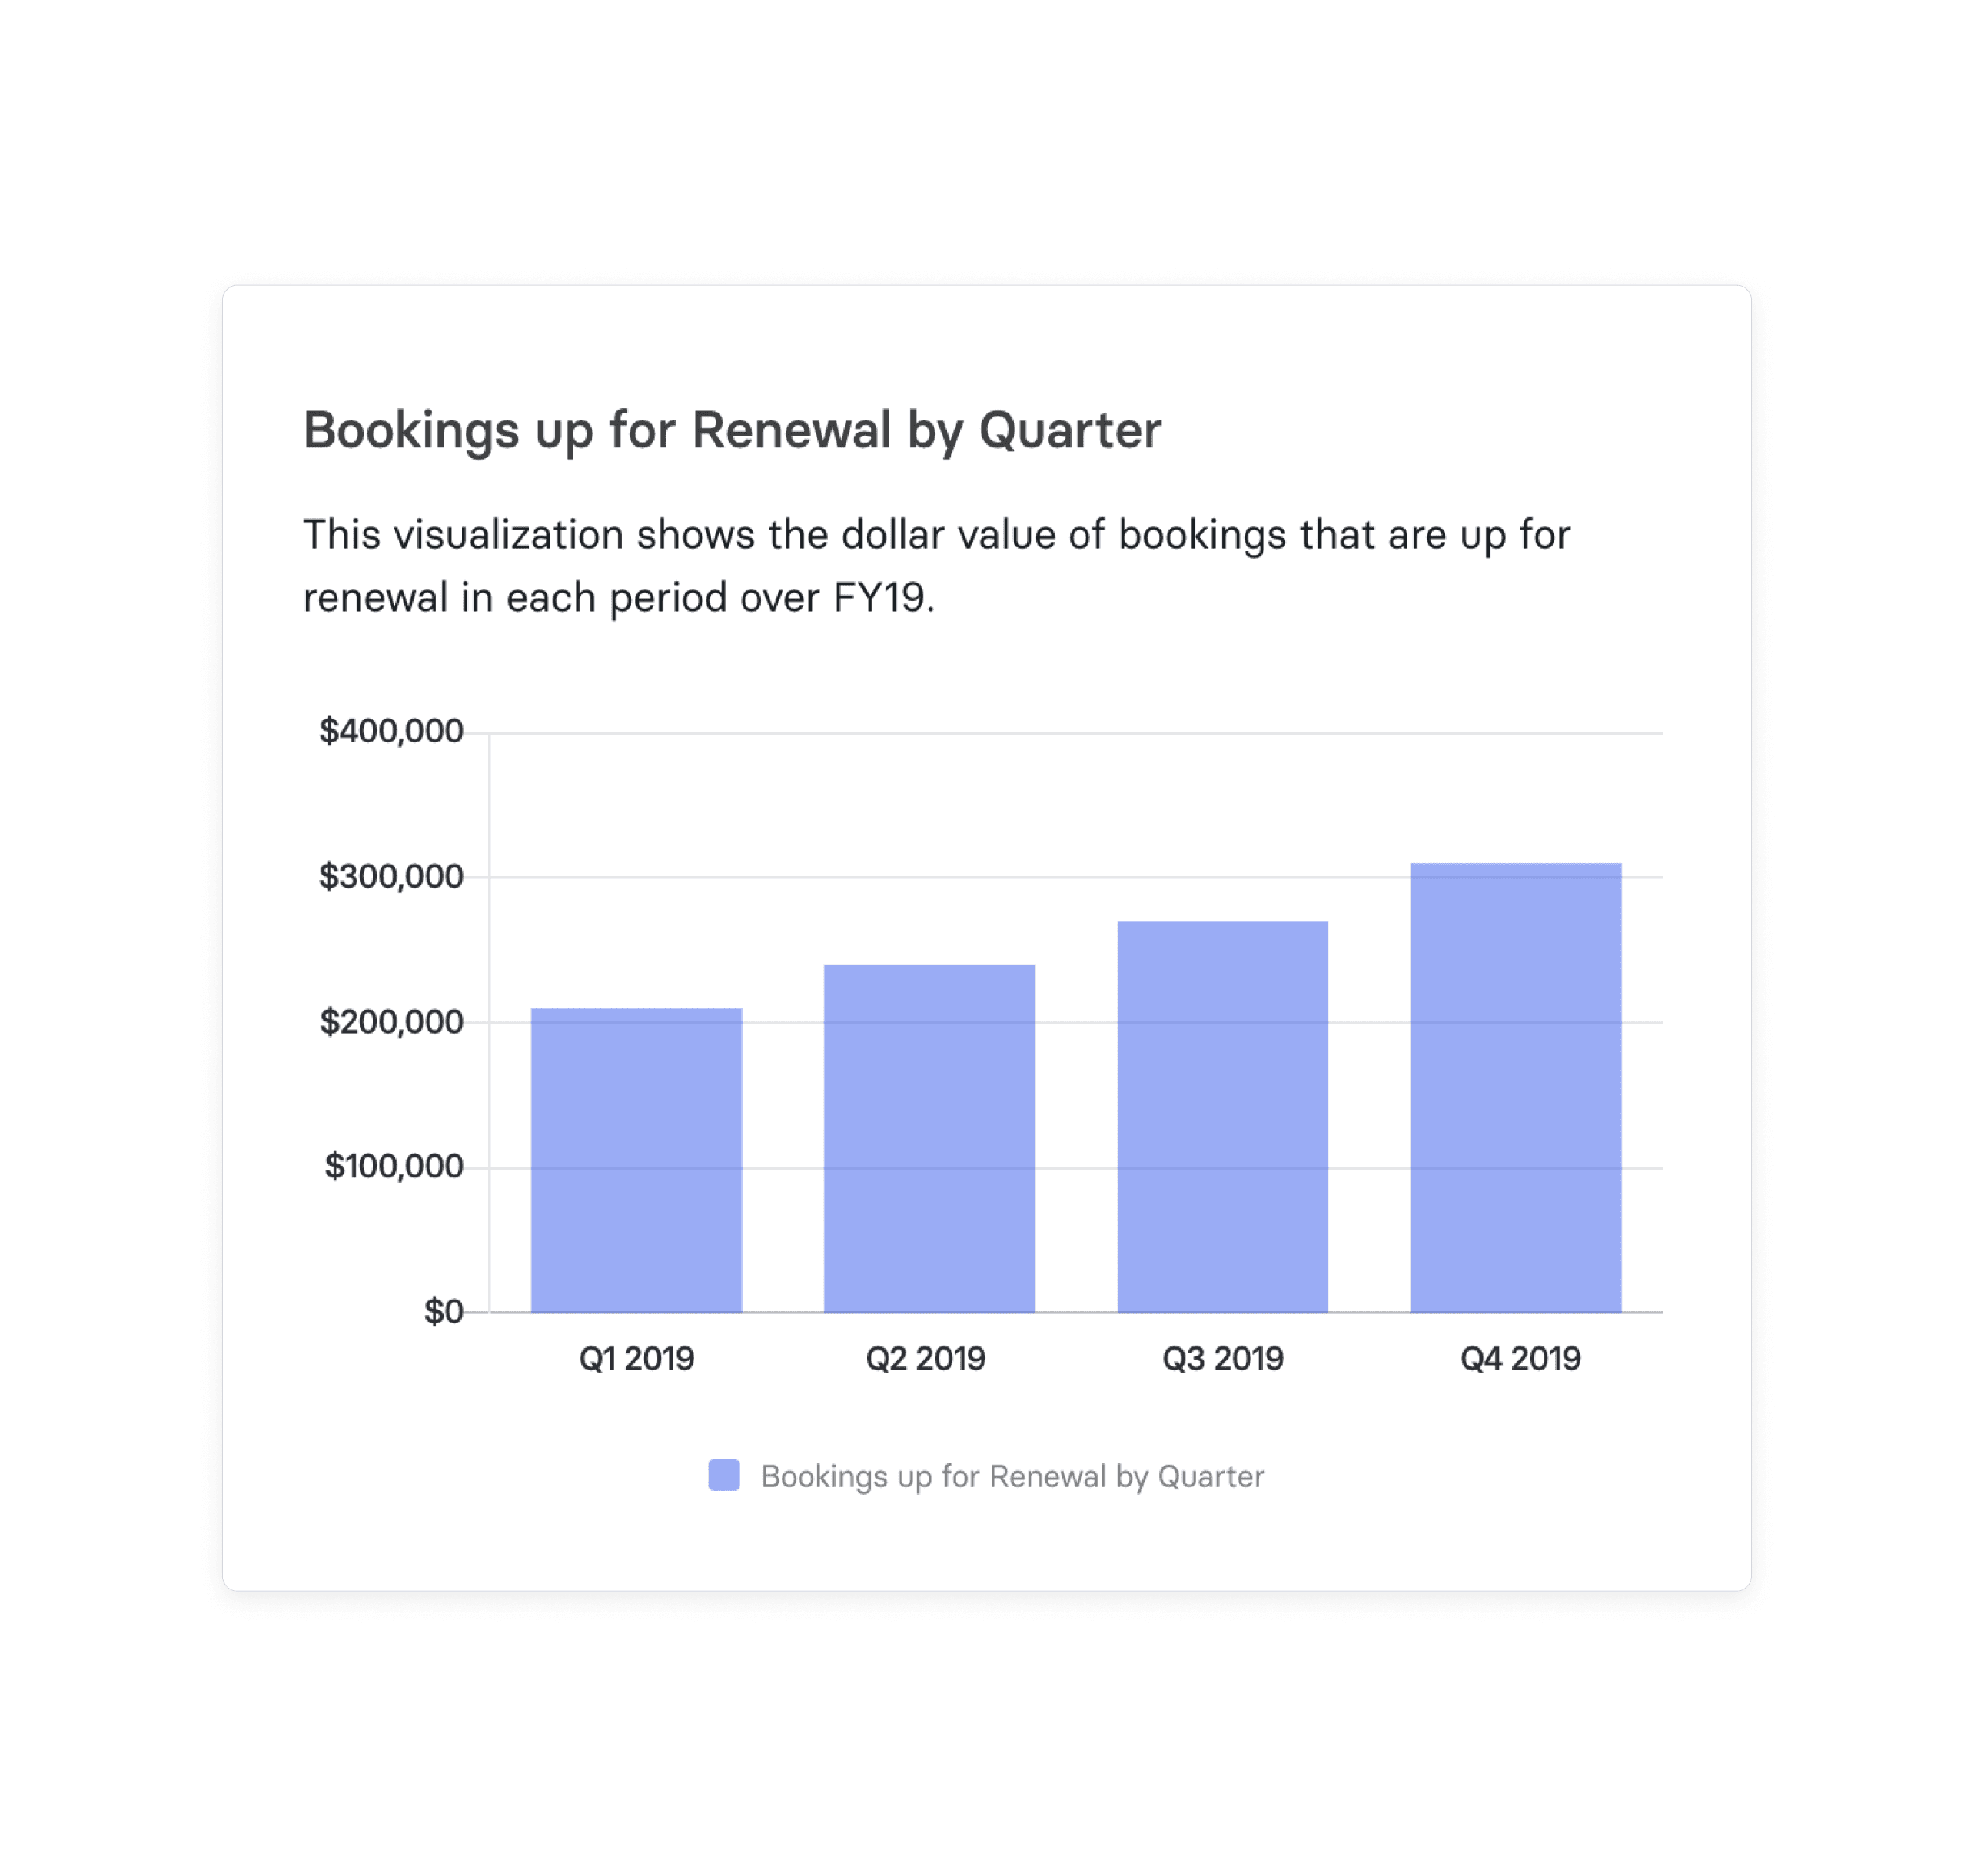
By tracking bookings up for renewal, you reinforce the importance of selling to existing customers and help your team members take a proactive approach to contract renewal. Over time, you can also identify your busy seasons for contract renewals and prepare your teams appropriately.
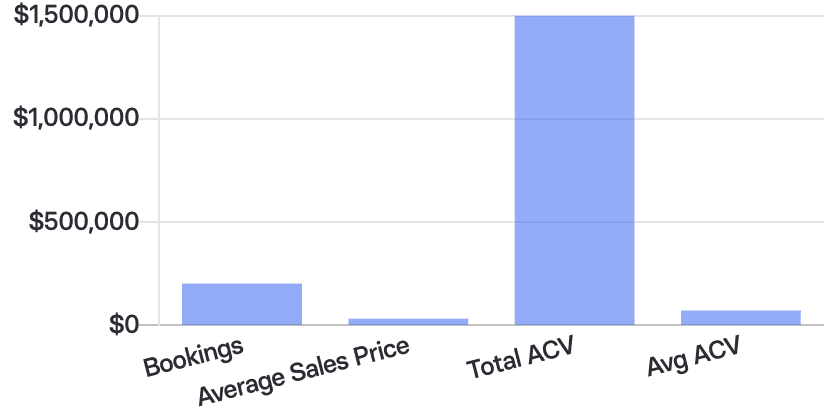
8. Average Deal Size
Average deal size, also known as average sale price (ASP), gives you the average revenue a new customer brings in on their first contract. Understanding average deal size gives you insight into your overall profitability. It’s essential for revenue forecasts.
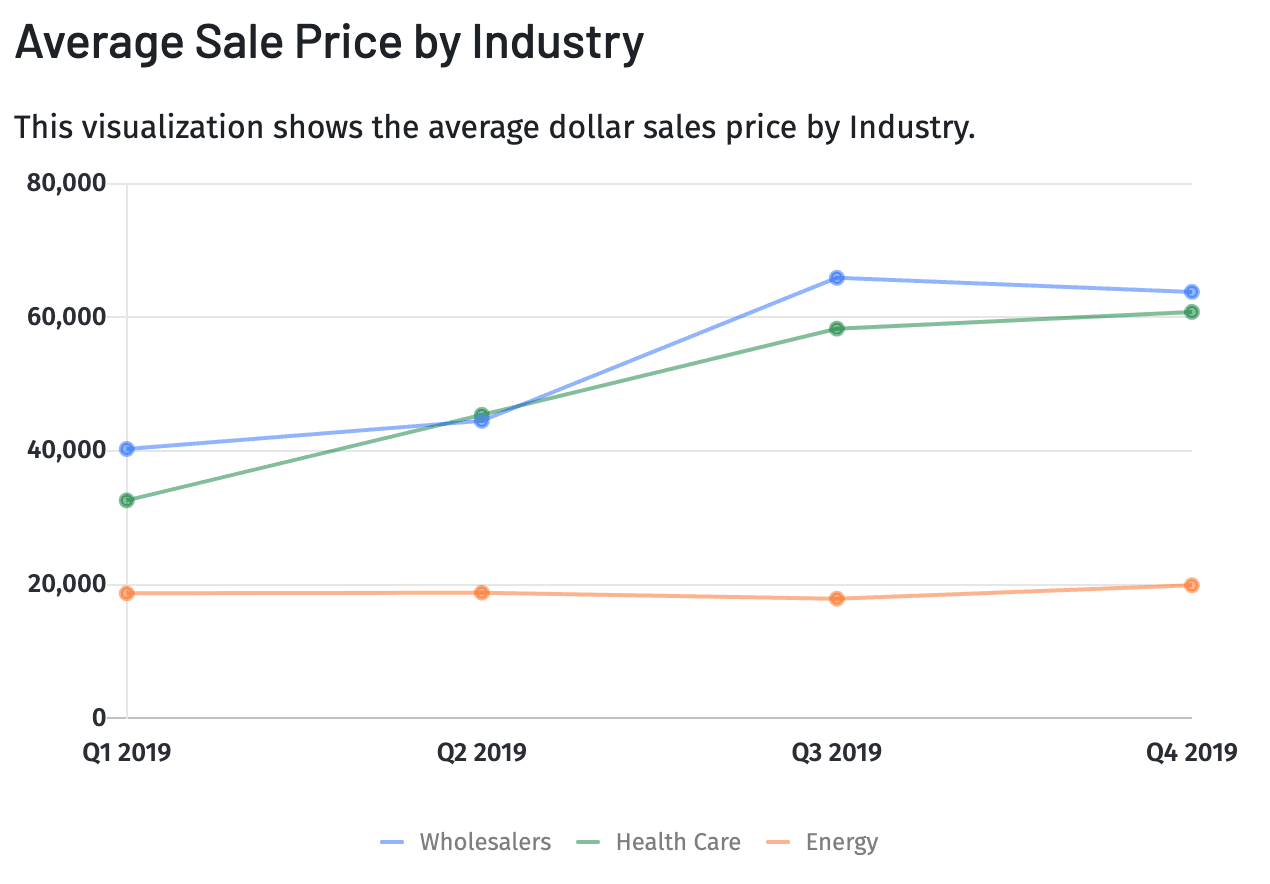
By comparing the contract value of different customer categories, you can also discover which industries are the most profitable for your business in the short term.
9. Customer Lifetime Value
While average deal size tells you the value of a customer upon their first sale, customer lifetime value (LTV) measures the total revenue you can expect to earn from a customer during their entire relationship with you.
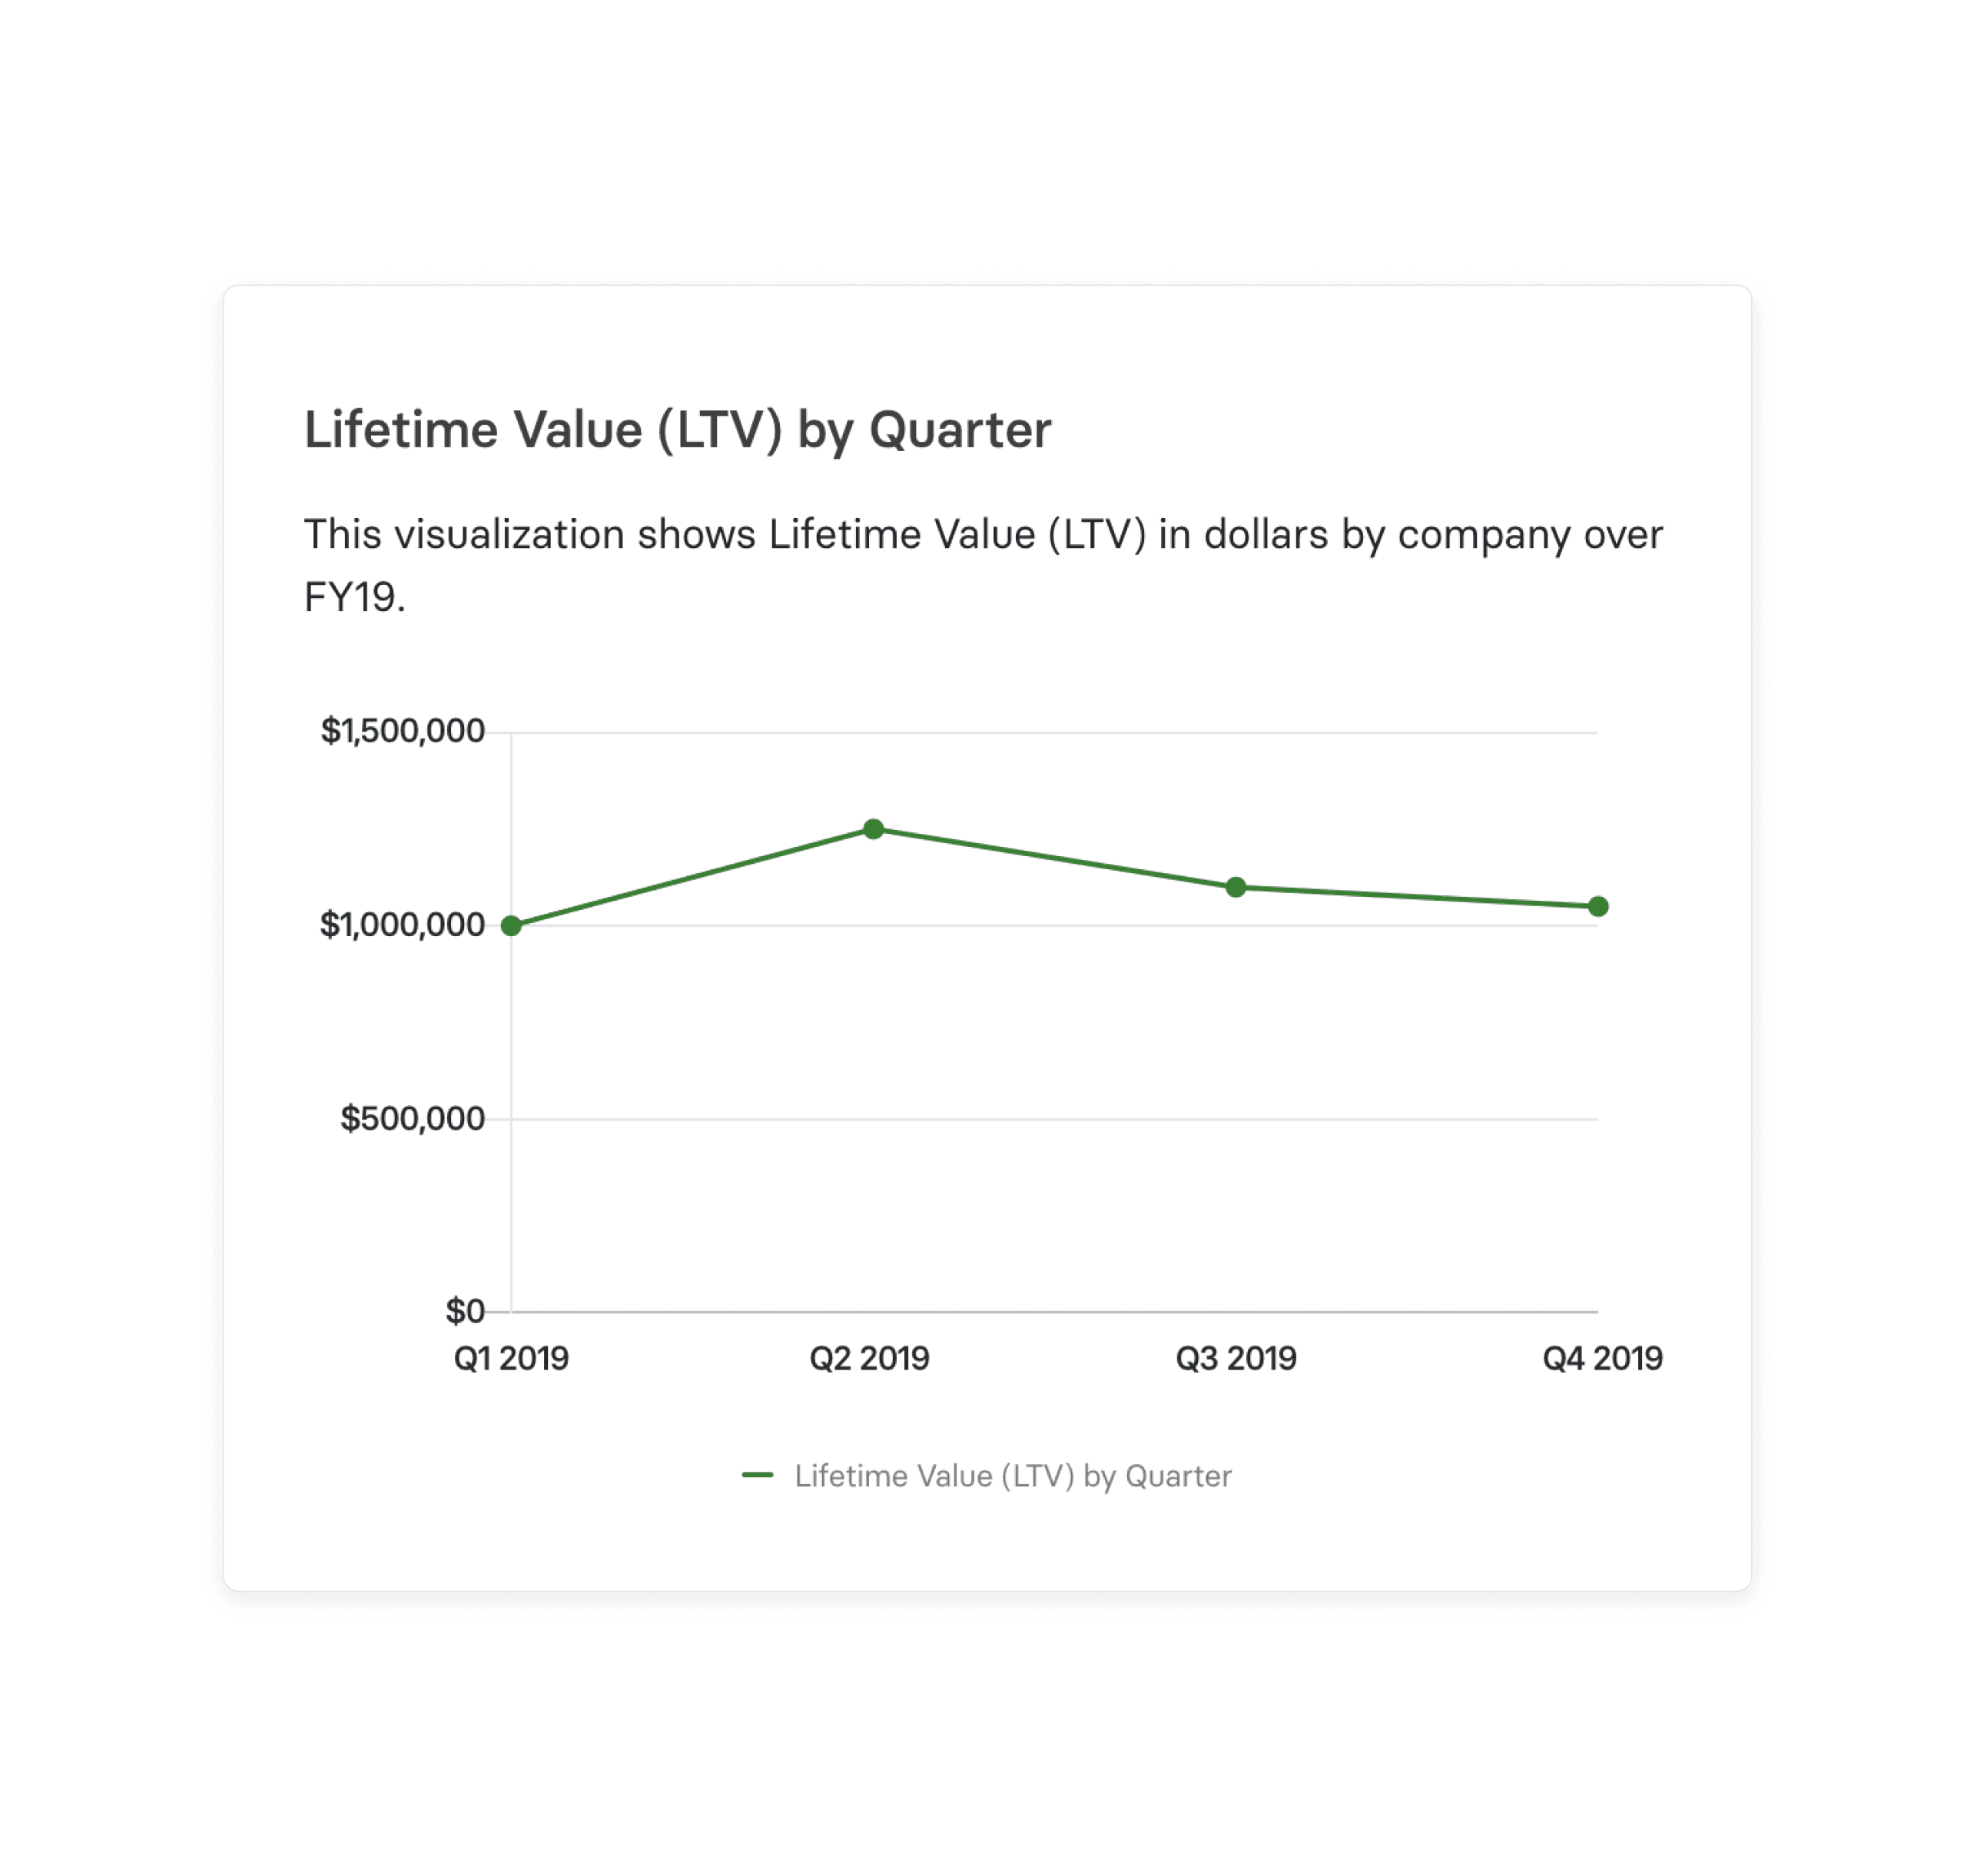
You can use customer lifetime value to help determine how much you’re willing to spend on gaining different types of customers.
10. Retention and Churn Rates
Retention measures the percentage of customers who renew contracts or turn into repeat buyers. And churn measures the percentage of customers who stop subscribing or purchasing from you.
In many SaaS businesses, the post-sales stage is the most crucial step in the sales pipeline. Monitoring customer retention metrics and churn helps you track:
- Customer satisfaction
- Onboarding
- Customer service
- Renewals
11. Sales Velocity
Given your current performance level and pipeline size, sales velocity tells you how much revenue you can expect to bring in per day. If it’s not a metric found in your CRM, you can calculate it using the following formula:
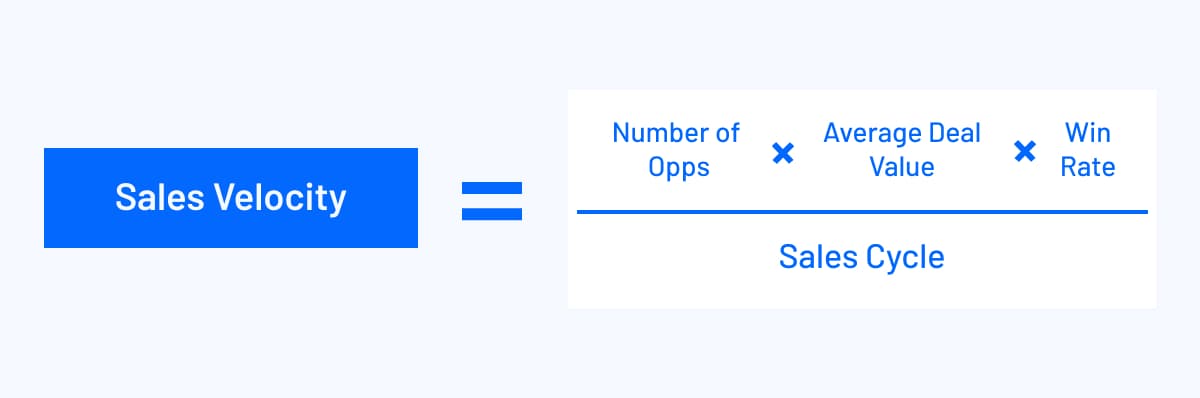
For example, let’s say you have 60 opportunities, an average deal value of $3,100, an average win rate of 30%, and your sales cycle takes 21 days:
Sales velocity = (60 x $3,100 x 0.3) / 21
Sales velocity = $55,800 / 21 days
Your sales velocity comes out to $2,657.14 per day or $79,714.28 per month. You can use sales velocity to help set realistic quotas and get a better idea of how much customer success support you’ll need to support the number of customers you expect to win.
12. Annual Recurring Revenue/Monthly Recurring Revenue
Annual recurring revenue (ARR) measures how much recurring revenue you can expect to generate from yearly contracts (or year-over-year). If you have monthly recurring subscriptions, you would use monthly recurring revenue (MRR).
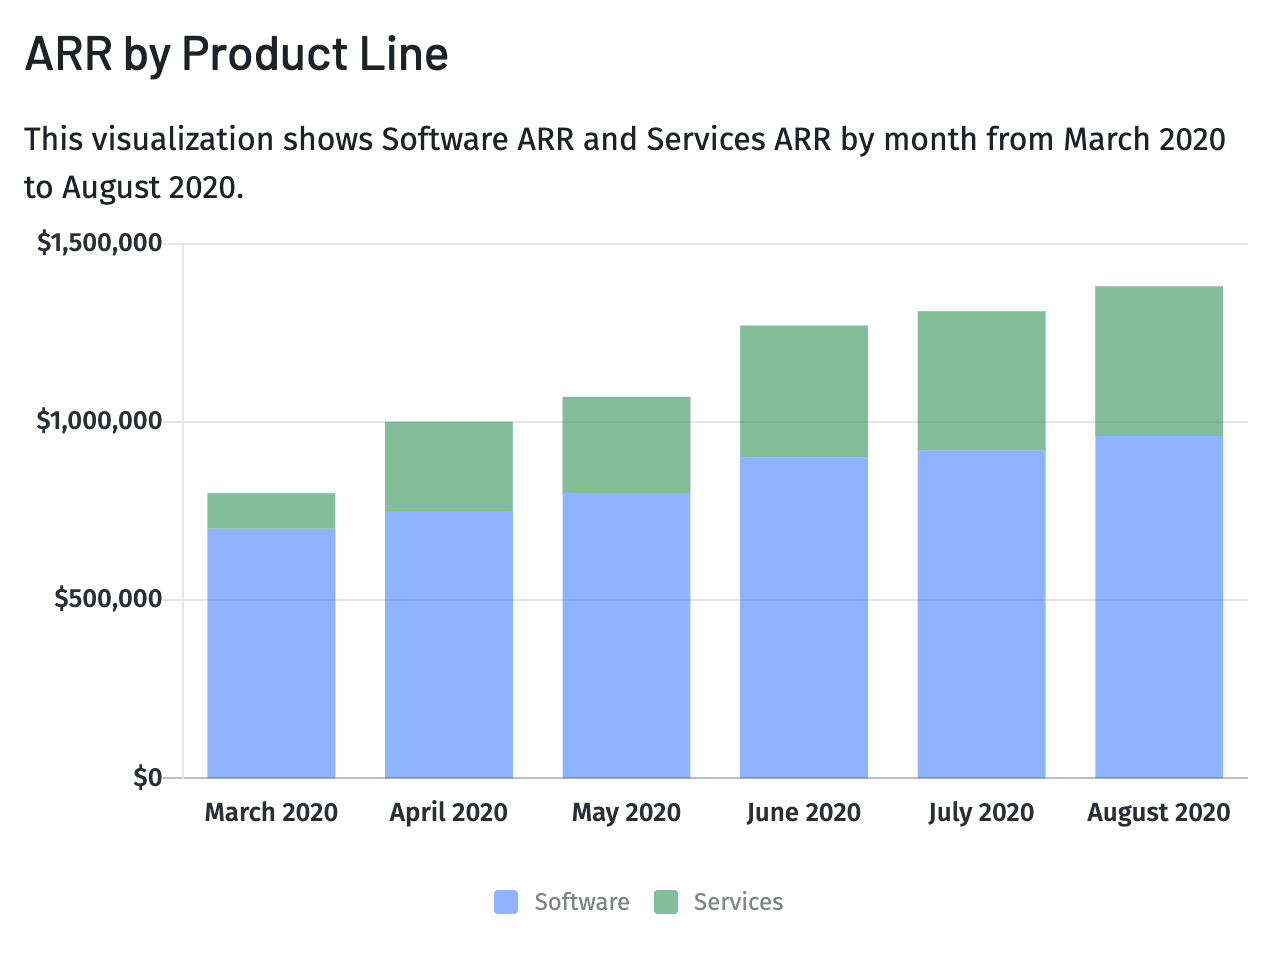
ARR and MRR are the most fundamental sales performance metrics for SaaS companies. A steady increase in ARR or MRR over time tells investors you’ve found a good product-market fit and your business has positive momentum.
As a revenue leader, you can break down ARR and MRR by product line to monitor your market fit and go-to-market effectiveness for each of your solutions.
13. Customer Acquisition Cost
Another sales metric investors look at is your customer acquisition cost (CAC). Your CRM calculates CAC by adding up your marketing and sales expenses and dividing the total by the number of new customers.
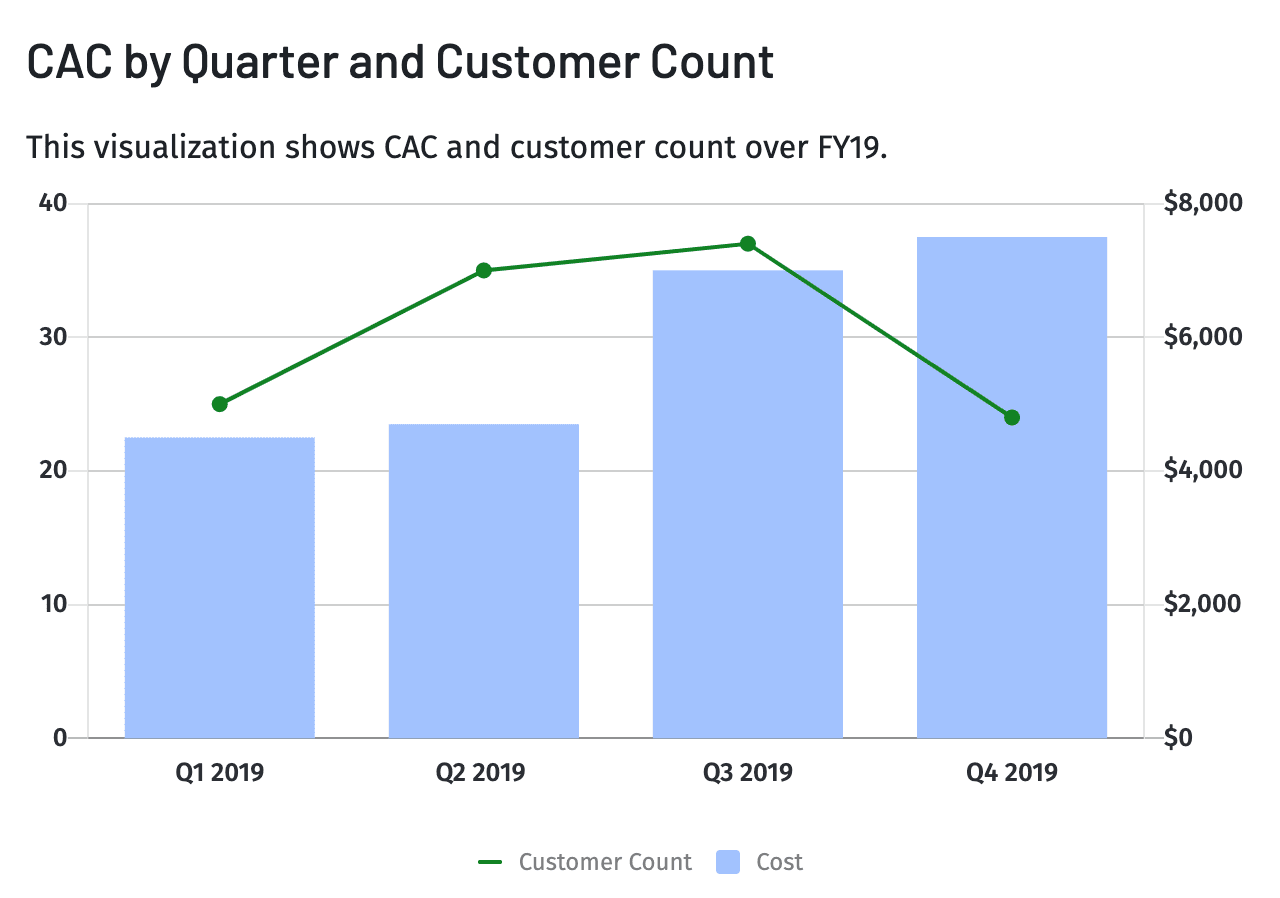
CAC is a valuable measurement of your unit economics that shows how much it costs your company to turn a prospect into a customer.
Your CAC provides insight into marketing and sales effectiveness. You use it in conjunction with the lifetime value of a customer to calculate your break-even point and profit margins.
14. Quota Attainment
To calculate quota attainment, take one sales rep’s total sales and divide it by their quota for a specific period to see how close they were to reaching their sales goals.
While measuring individual performance is essential, revenue leaders can also use quota attainment to determine whether or not they’re setting realistic sales goals. According to the Bridge Group, only 66% of sales reps achieve quota attainment each year.
Having deep visibility into quota attainment—by rep, product line, customer segment, etc.—is crucial to effective revenue forecasting. A blanket financial assumption that quota attainment will increase by 80% works, but the more accurate you can get to your historical data, the better.
Track the Right Sales Metrics to Create a Strong Bond with Finance
Modern CRMs have sales analytics features that let you measure and monitor almost any activity metric that comes to mind. Revenue leaders have the challenge of sifting through and identifying the metrics that have the highest impact on your company.
The sales metrics you track should matter to stakeholders while keeping your team focused on the right activities. To better synthesize your sales process to your strategic goals, explore our webinar covering the 4 Traits of a Highly Effective Sales-Finance Partnership.
How Strategic Finance Software Can Help Sales & Marketing Teams

Sales Performance Metric FAQs
How do you analyze sales performance in SaaS?
There are many different metrics to analyze your sales performance, but your main focus should lie on tracking how your pipeline is growing, how efficiently your team is closing deals, and identifying potential issues early on. Relevant metrics include sales cycle length, deal conversion rates, and retention and churn rates.
How can you track sales performance metrics?
What is the difference between sales metrics and sales pipelines?
What are the top three essential sales metrics SaaS companies should track?
Explore Related Metrics


Own the of your business.
