

No matter how good you are at forecasting and forward planning, things never work out exactly as you expected in business. Demand fluctuates, market conditions constantly shift, and marketing efforts pan out better (or worse) than expected. So, does that mean finance teams shouldn’t bother with forecasting at all? Definitely not. But it does mean that it’s vital to understand how your company’s real-world, actual results compare to your planned budget.
And that’s not just for curiosity’s sake. By staying on top of how you’re tracking against your projections, you can adjust your strategic plan along the way. Variance reports can help you identify issues that need to be addressed each month or quarter and help you stay on track to reach your biggest goals, even if the plan to get there changes.
This step-by-step guide shows you how to create variance reports in minutes and covers common challenges, so you know how to avoid them. Let’s dive in.
Table of Contents
What Is Variance Reporting?
Variance reporting is a type of budget analysis that compares actual costs or revenue to the budgets or plans that were forecasted ahead of time. Variance reports may show you the percentage difference, or deviations, between forecasted numbers and the actual amounts at the end of a specific period.
At the start of a year, quarter, or even month, executives create a strategic plan and budget for the coming year. They’ll lay out their objectives and then put in place a budget which aims to achieve them.
The word budget automatically sends us to thinking about expenses, but here we’re talking about revenue as well. The budget will be based on expected sales, forecast refunds, cost of goods sold, government incentives, and essentially every other financial line item the company expects to receive or payout.
This can obviously result in positive variance or negative variance, with the difference between the budgeted and actual figure referred to as the ‘delta.’
Why Real-Time Variance Reporting Is Important
The variance reporting process is incredibly important for a company, as it can help identify issues and areas of focus for finance and the wider business. But traditional variance reporting makes it difficult to derive real strategic insights.
It’s fine to say that the company is spending more than it had planned, but if you can’t drill down to find out exactly where that extra spending is coming from, it’s almost impossible to make the right strategic decisions to fix it.
That’s why it’s important to use financial reporting software with real-time data to produce variance reports. With a tool like Mosaic, you get instant access to a consolidated view of all of your company’s financial data — there’s no need to spend days or weeks digging through Excel spreadsheets to pull together a variance report.
Not only that, but it’s easy to drill down into those figures to find out exactly where your variance is coming from, and why. Variance reporting is a key component of your company’s financial storytelling, which is why it’s so important to get it right.
How To Produce a Variance Report in Mosaic
Mosaic gives finance teams the ability to create variance reports in minutes, not days or weeks. Because Mosaic integrates with your CRM, accounting, and other software, the reports and dashboards within Mosaic are based on real-time data, which means you can spend less time collating data and more time improving your strategy to drive revenue and grow your business.
Create a Budget Variance Report in 4 Steps
Building a budget variance report in Mosaic is simple.
Step one
On your Mosaic dashboard, select ‘Analysis’ on the left-hand side and then across the top menu choose ‘Add a report.’ From the pop-up menu, click ‘Custom Reports’, and then select ‘Variance Report.’
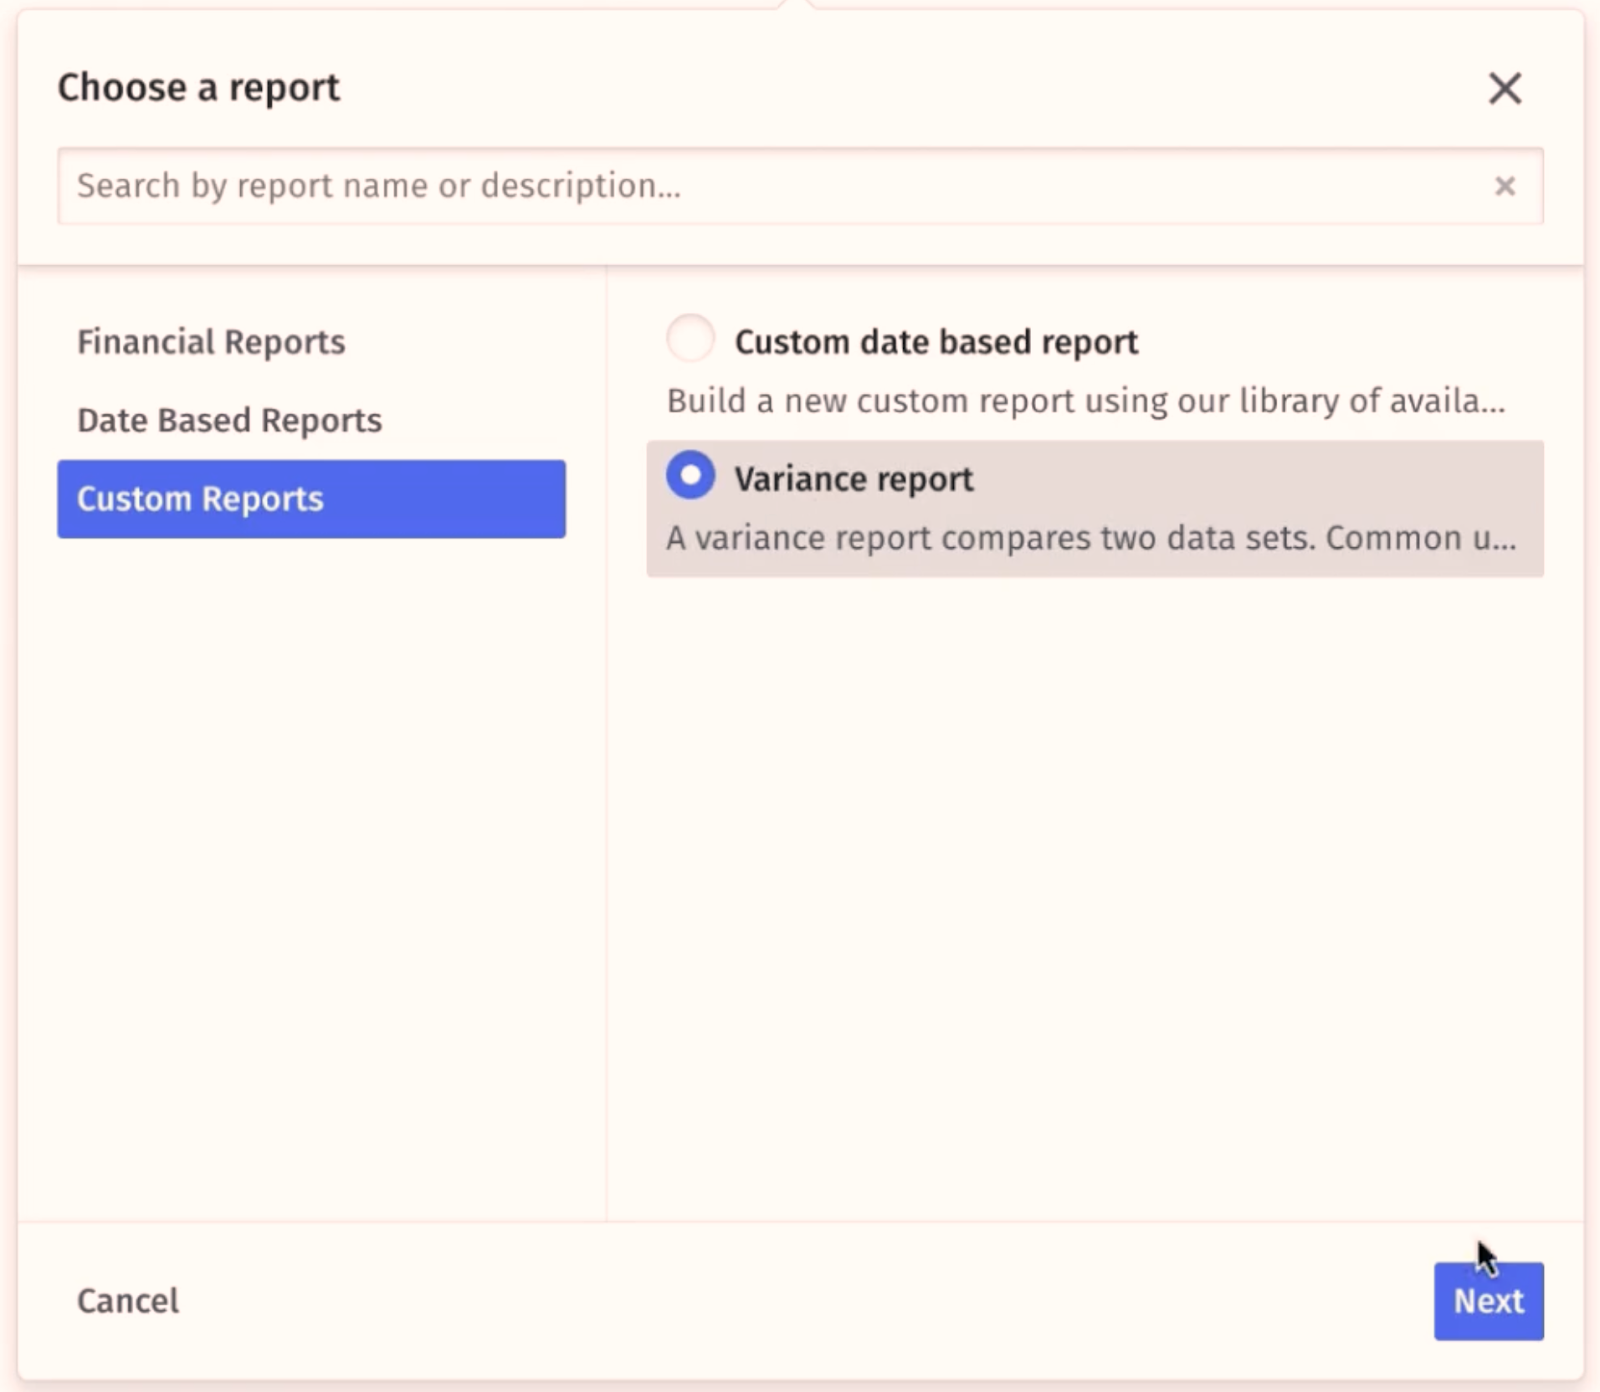
Step two
Choose which data you want to compare. This can be data that offers a high level overview, like net operating income, or it could be a more specific metric, such as customer acquisition cost or operating expenses.
In most cases, you’ll want to select a number of different metrics to compare in a single report, and over time, you’ll gain a better understanding of which are the most valuable to your team and other decision makers in the business.
Once you’ve selected all your chosen metrics, hit ‘Confirm.’
Step three
Now you’ll be presented with a simple table, which shows you four columns of figures. The first two columns are the different datasets you’re comparing, with the third and fourth (the Delta) showing you the difference between those two figures in both dollar and percentage terms.
From here, you can adjust which figures you’d like to compare by clicking the three vertical dots on the top right-hand side of the table, which brings up an additional menu. To change the data in column A or B, go to the tab marked ‘Data source’ and select what you want to see.
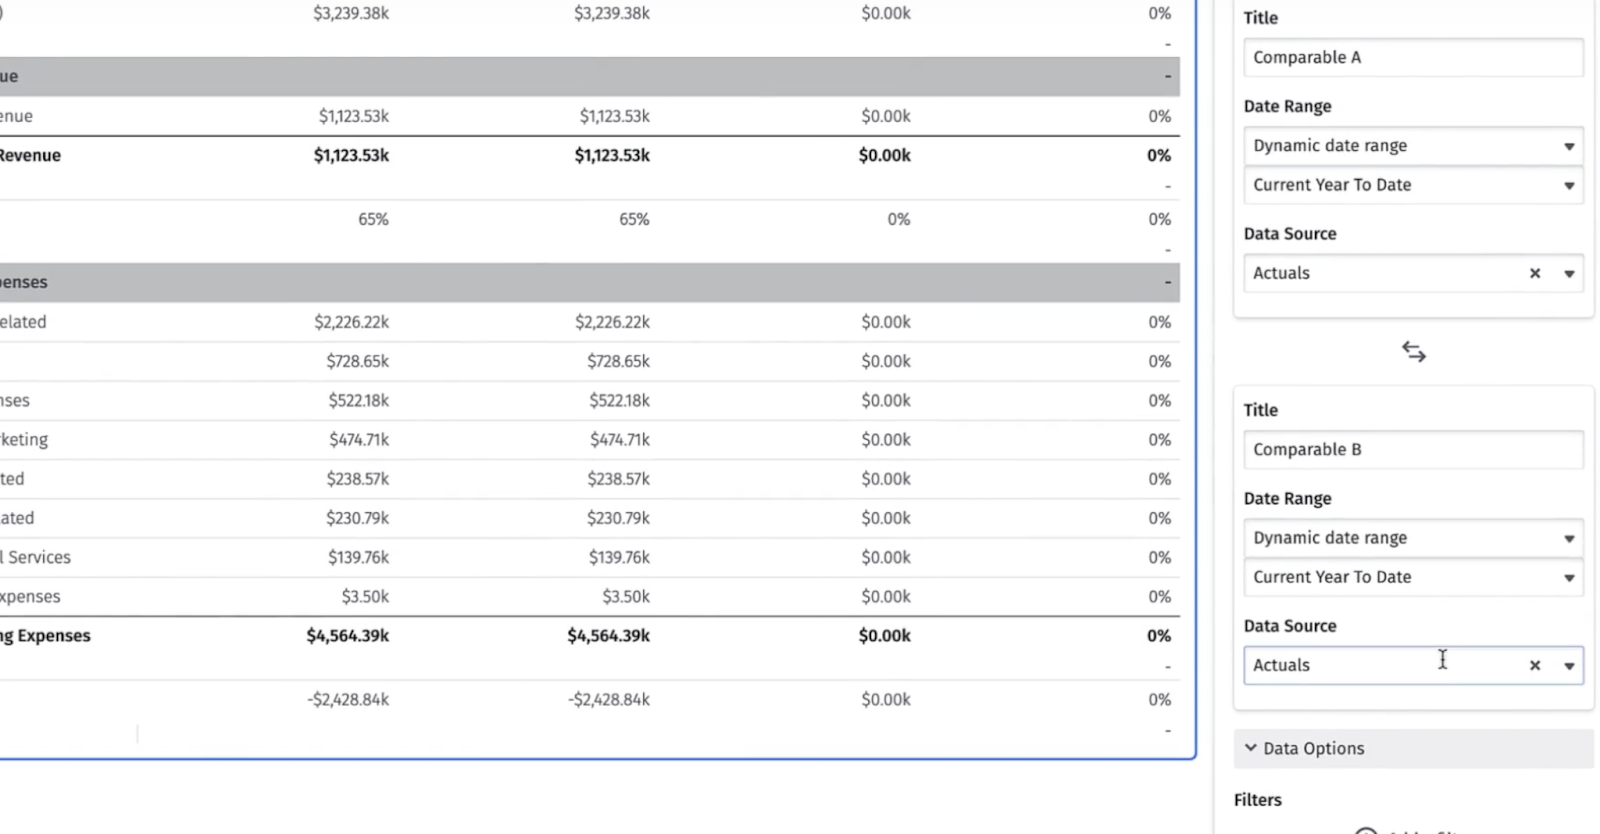
For a budget variance report, you’ll want to choose your budgeted numbers for one column and your actual numbers for the other. You can also select any date range you want from this menu, depending on which timescale you need to report on.
To make the report clearer, you should also amend the Title section to reflect the Data Source you’ve. For example, by changing ‘Comparable A’ to ‘Budget 2023.’
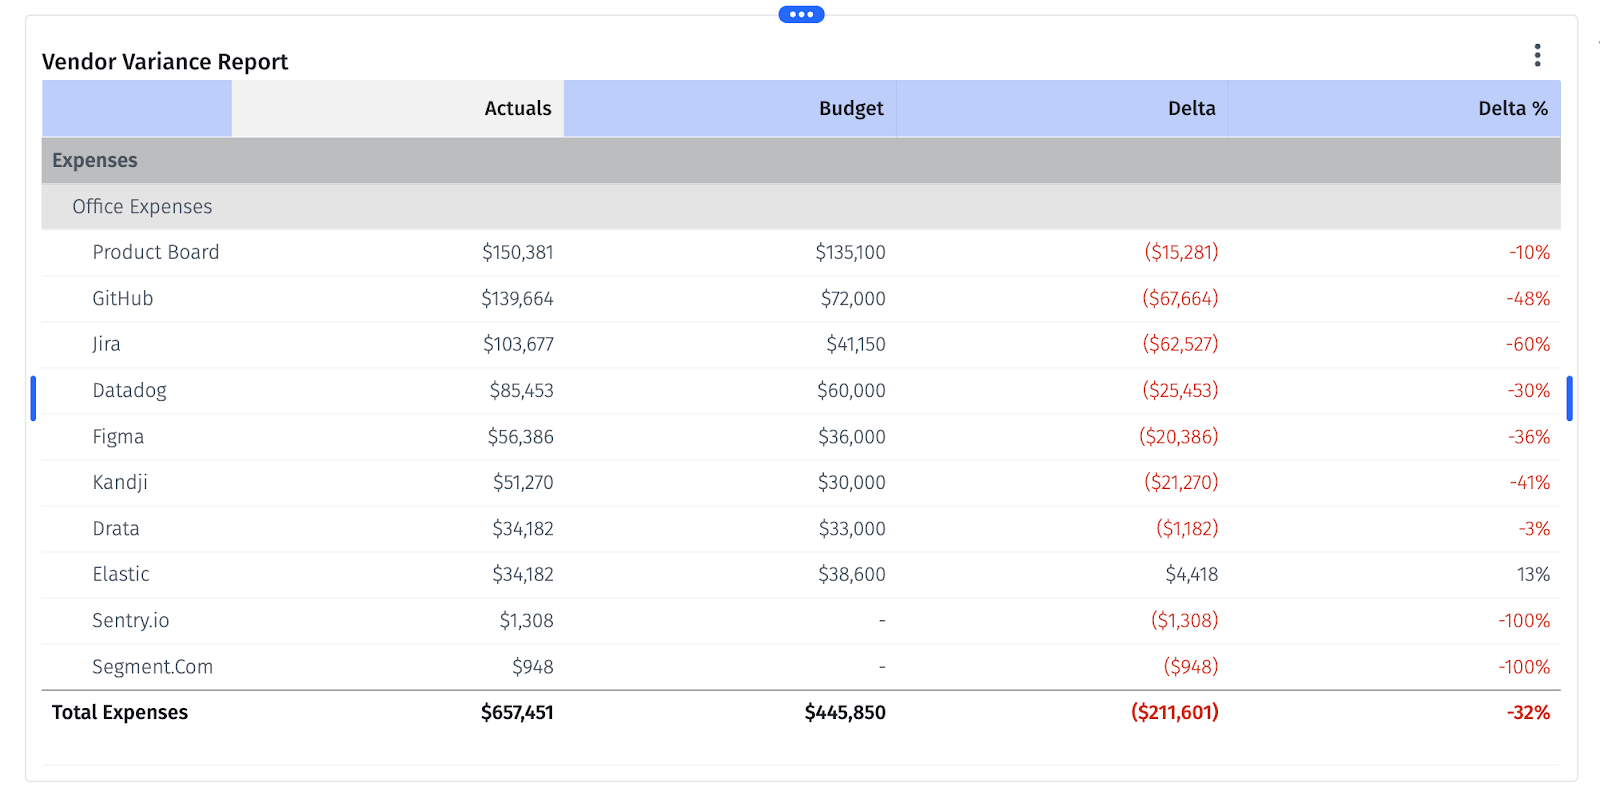
Since Mosaic also allows you to forecast at the vendor level, you can also look at your variance against forecasted vendor spend compared to actual vendor spend. This is a powerful feature helping you nail your bottom up budget.
Step four
The final step in the process is simply to customize the look of the report to your preferences. This makes it easier for you to see the budget variances for different categories and amend things such as decimal points or color schemes.
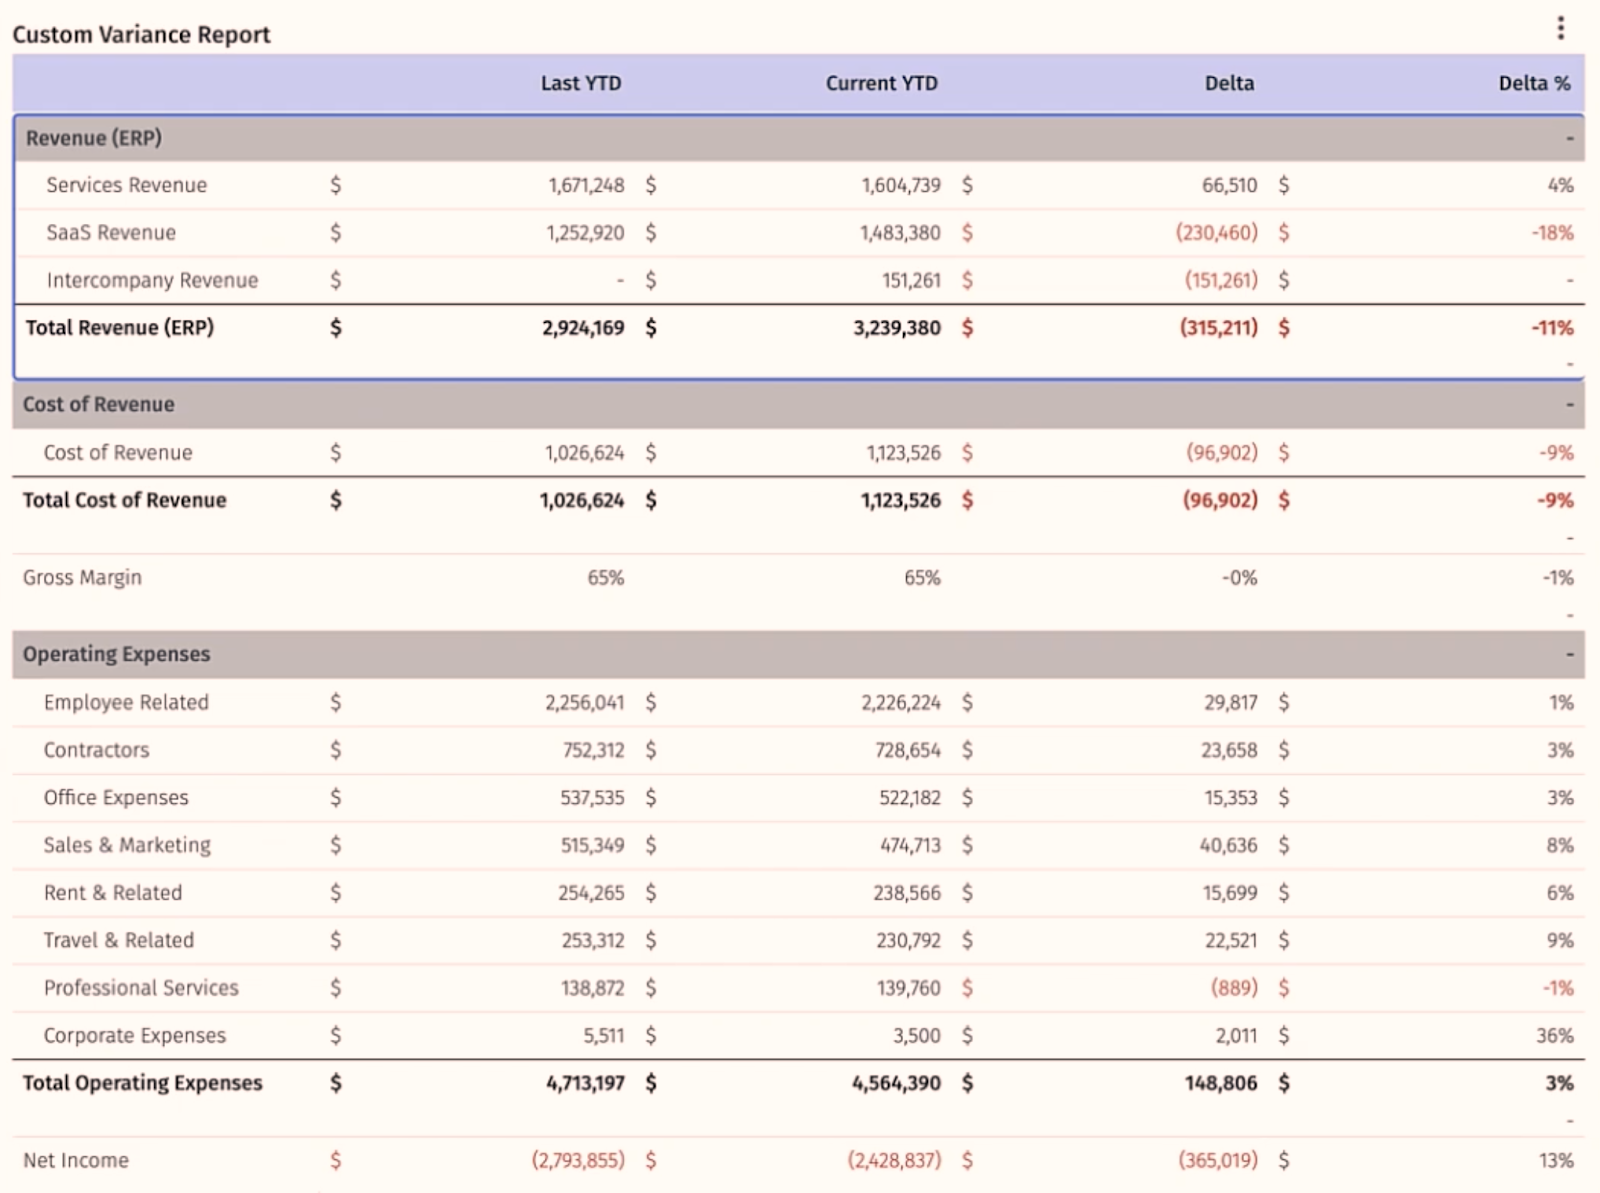
Once that’s all done, you’ll have a custom variance report that provides you a clear overview of how your company is tracking, as well as a solid base to start digging into why the variances are occurring.
And the whole process takes less than five minutes.
Analyze Headcount Variance in 3 Steps
When you start to look at specific metrics, the overall process is similar to the general variance reporting process. Here are the simple steps you can take to analyze your headcount variance in Mosaic.
Step one
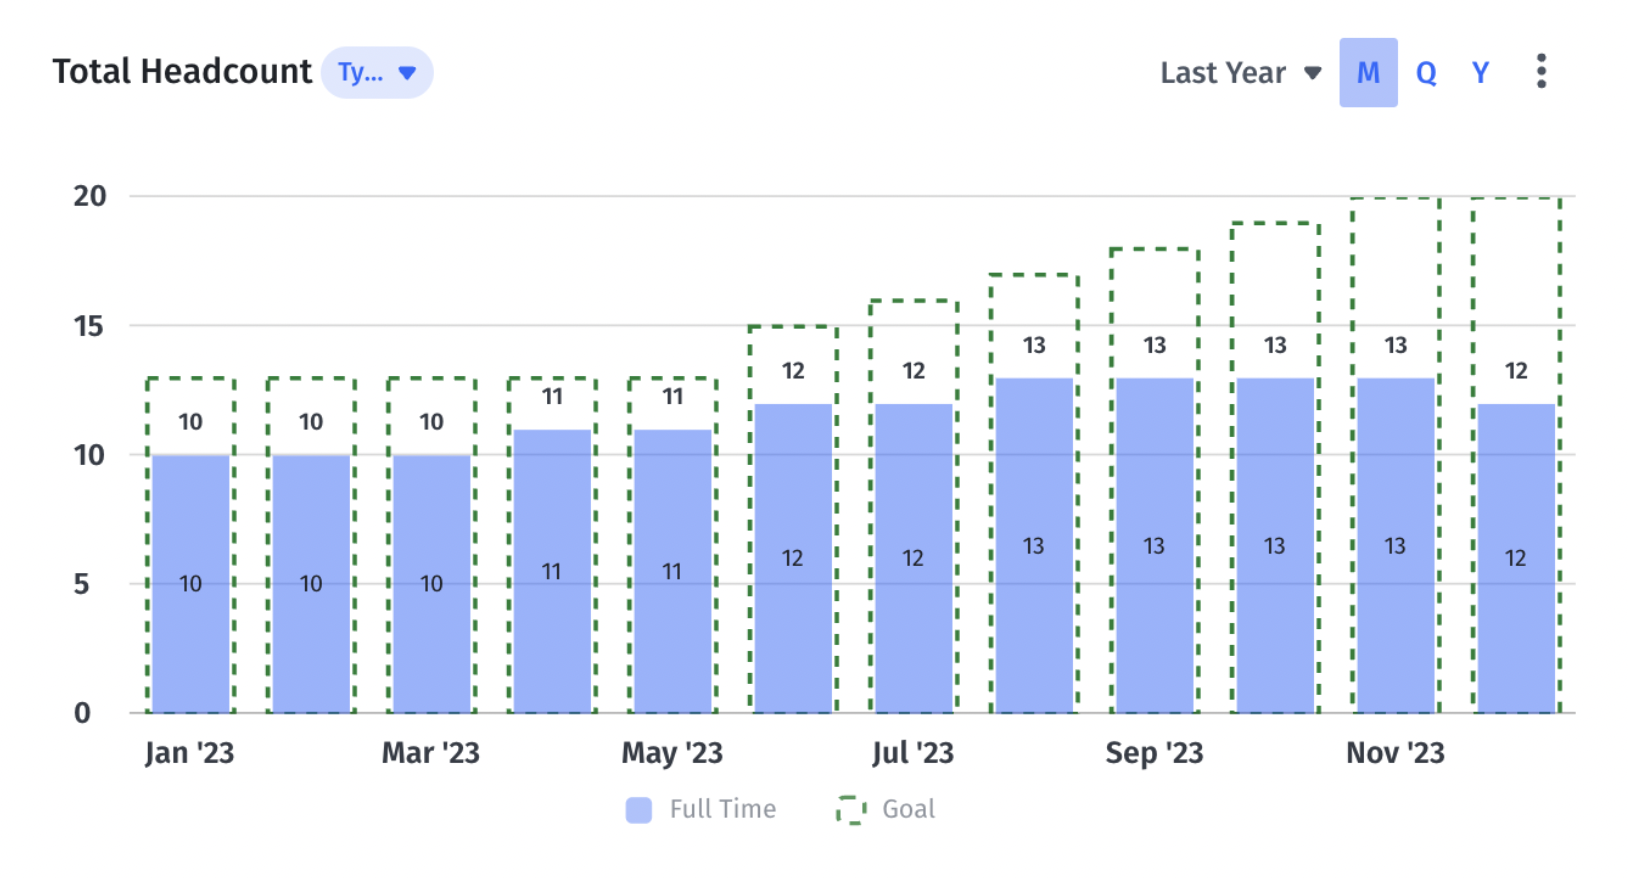
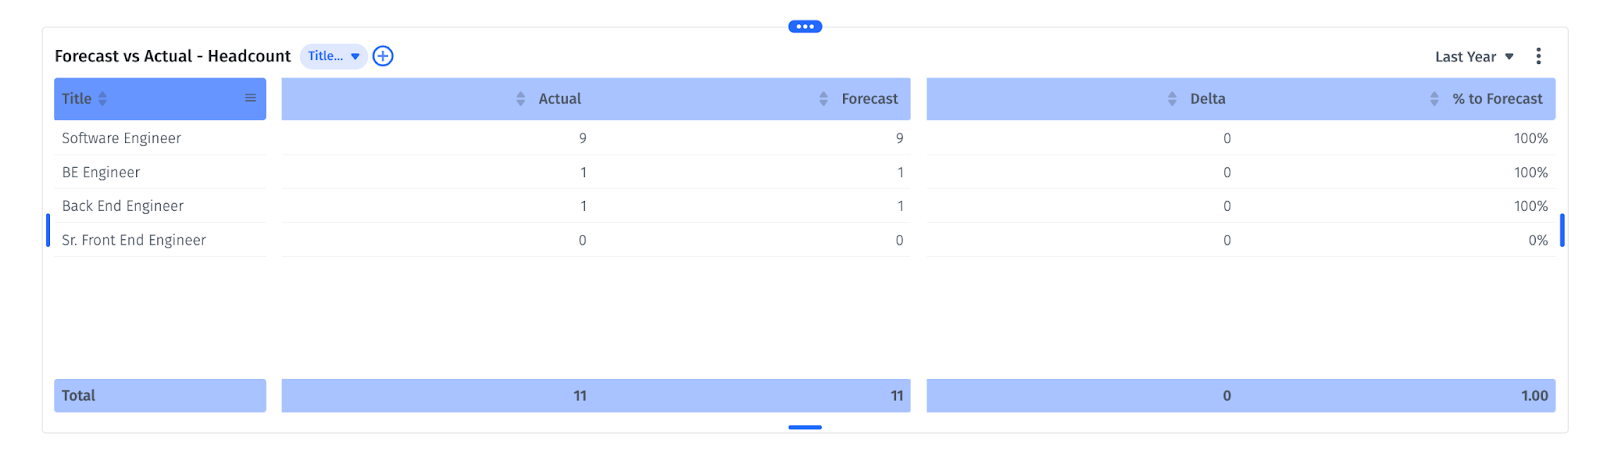
Review your baseline scenario for headcount. While it can be worthwhile to see the total number, it’s more valuable to be able to see a breakdown of this planned figure by individual departments.
In Mosaic, you can find the information in the Analysis tab in the ‘Forecast vs Actual’ Mosaic template.
Step two
Compare the baseline forecast figure to the actual headcount in the business. This may show you that everything is on plan and exactly as you expected to see, but it could also raise questions.
Step three
Analyze the data. The most important aspect of headcount variance is understanding why. Is the sales team headcount growing because the existing reps are underperforming? Is engineering short, explaining the delays in getting product features to market?
Digging into details on headcount can highlight issues within the business and give you insight into how to help solve them.
Analyze Ramp Rate Variance in Mosaic
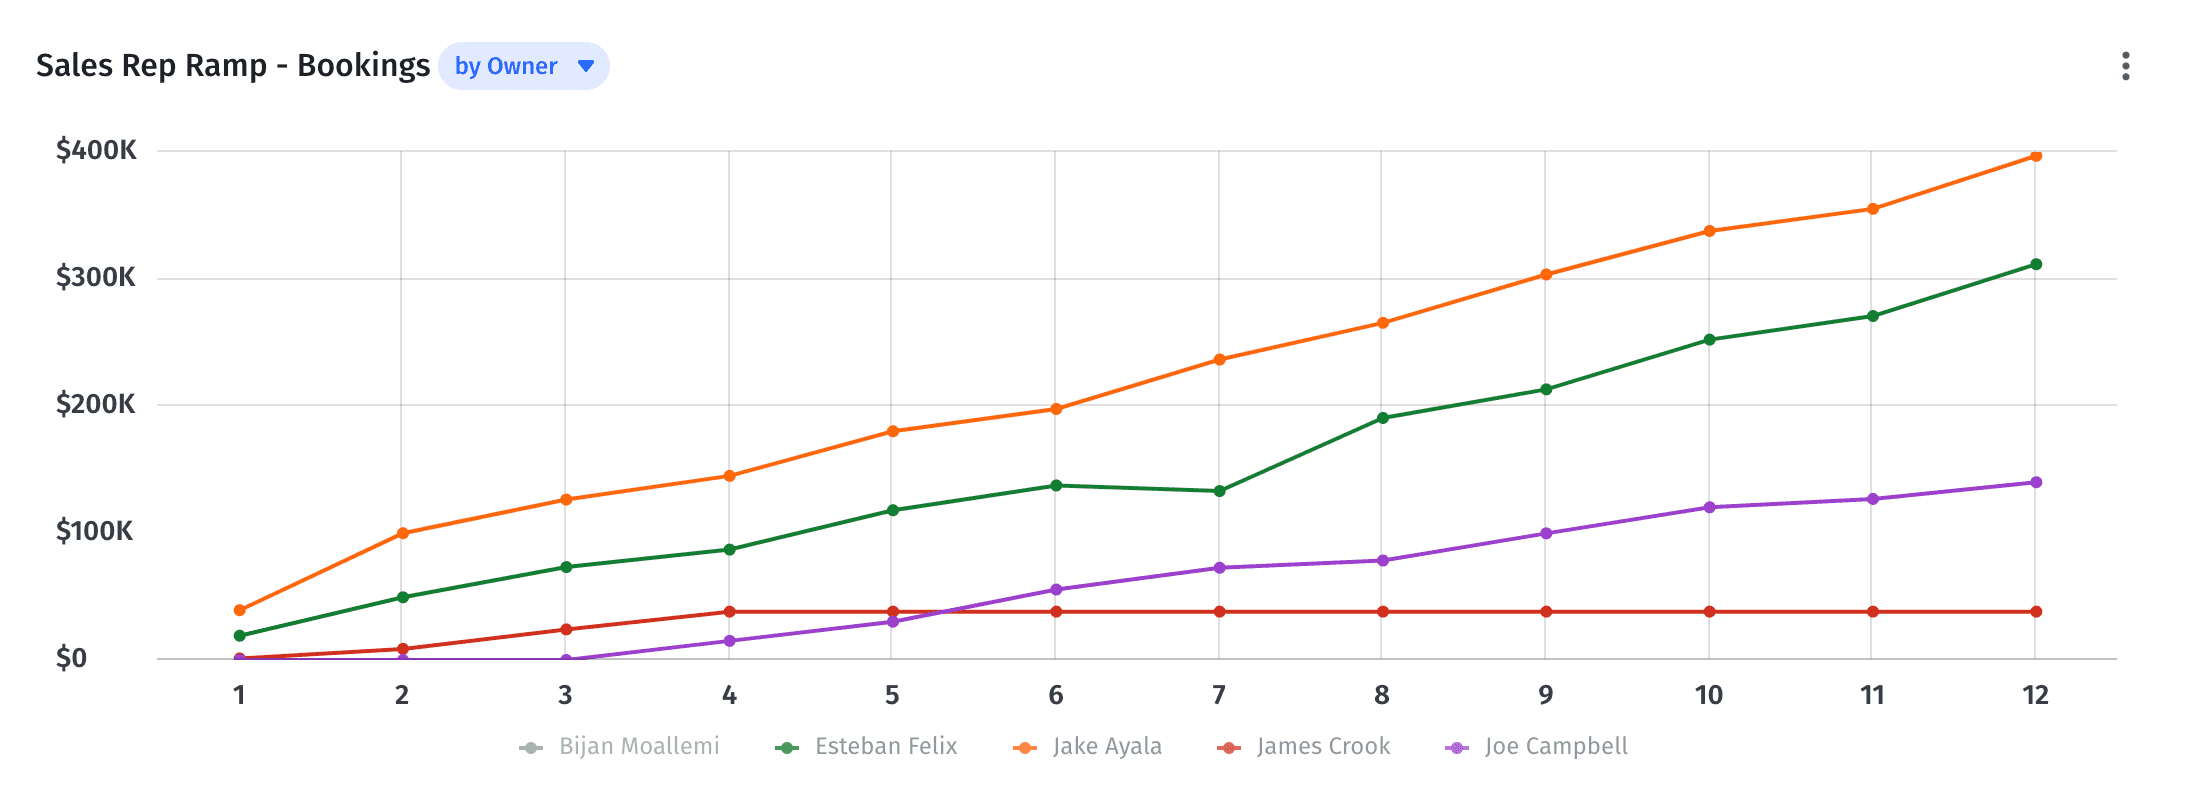
Ramp rate variance is a little different from the other variance reports we’ve looked at so far. Here, we’re looking at how your sales reps’ ramp rate compares. That is, how long does it take a new hire to get up to their full potential.
It’s not a case of reviewing a single reporting period because at any one time, you’ll be trying to compare brand-new sales hires with 10 year veterans, making it hard to see how their performance compares.
The ramp rate views in Mosaic simplify this entire process, pulling in data from sources like Salesforce and Gusto and normalizing the data based on their individual start dates. It means you can easily compare how each of your reps’ ramp rate varies from the average based on their individual time in the role.
Analyze Sales Quota Variance in Mosaic
Sales quota variance can be viewed in a similar way to ramp rate variance but without the need to normalize the data. In essence, it’s a simple tracker showing how your sales team is stacking up against their targets.
In Mosaic, you can view a simple dashboard that shows how your team is performing against the budget. This data can be displayed across the entire team or drilled down to individual performance, giving you insight into which staff needs additional training or support.
Common Variance Reporting Mistakes
Variance reporting is an area that can be easily misunderstood, and there are a number of common mistakes that finance and FP&A teams make. Here are a few things to avoid when creating your own budget variance reports:
Using Old Data
If you’re creating variance reports the old-fashioned way, this one’s hard to avoid. When data is collated and organized manually, it takes time. Unfortunately, the rest of the business can’t wait around for financial reporting, so they need to start planning for the next quarter before the last one is even finished.
That means that by the time the budget variance reports are done, the next period is already underway, strategy has been decided, and funds have been allocated. If you use spreadsheets and manual processes for variance reporting, your team is going to spend a lot of time on tasks that yield very little tangible benefits.
Broad Categorization
In order to understand why there’s variance in your numbers, you need to be able to see where they’re coming from. In simple terms, it means categorizing your data in a way that’s usable.
For example, if you bunch everything under ‘Staff Costs’ and it comes in over budget, it doesn’t really tell you much. Are you paying higher salaries than expected? Is your headcount higher? Or are there ancillary costs like subscriptions or benefits that are higher than you planned for?
You don’t want to have a thousand line items in your report, but it’s important to categorize the data in a way that’s specific enough to be useful.
Using Spreadsheets (and Financial Model Templates)
SaaS financial model templates sound like a great idea. Cut down on time by plugging your data into a pre-built spreadsheet, so you don’t need to create all the formulas from scratch.
The problem is that spreadsheets and templates leave you very little flexibility when it comes to how you assess the data. Because you don’t know what’s behind the numbers, you have no way of knowing if they’re correct or why they’re coming out a certain way.
Even if you do create the formulas from scratch, spreadsheets are still severely limited. Finding the root cause of an issue involves combing through lines and formulas — not to mention the potential for fat finger or copy and paste errors.
Why Variance Reporting Isn’t Enough
The biggest mistake when it comes to variance reporting is stopping at reporting. There’s very little value in simply offering up a plus or minus figure to senior executives without looking at the context behind those numbers.
This is where Mosaic variance analysis software comes in — it allows finance teams to transition from historical record keeping and the business of ‘what,’ to becoming a key strategic advisor with a focus on the ‘why’.
A textbook example is marketing spend. A simple view of a variance would look at overspending as a bad thing, which might lead you to the conclusion that your marketing spend needs to be wrangled back within budget. However, if marketing has been generating exceptional results from a particular campaign, then allocating those additional resources makes a lot of sense.
Business is all about trade-offs and understanding which ones make the most sense based on your unique goals. Obviously, there is a finite amount of money to work with, but finance teams need to take a holistic approach when analyzing a variance report. All budgets will, and should, flex to the changing needs of the business.
The speed at which Mosaic can create variance insights makes this more possible than ever, giving finance teams the ability to iterate on their baseline in seconds, adjusting forecasts to take account of the latest information.
It makes variances reports not only more accurate and holistic but also flexible, living components of the strategic decision-making process.

Variance Report FAQs
How can Mosaic help with variance reporting?
Mosaic simplifies the variance reporting process, allowing finance teams to build custom reports in minutes. Without the need for hours of manual data entry and categorization, they can shift their focus from collecting data over to strategic analysis that looks beyond the numbers.
What are the different types of variance reports?
How often should companies conduct variance reporting?
What is favorable variance?


Own the of your business.
