Headcount Reporting Metrics, Dashboards, and KPIs Explained
What Are Headcount Metrics?
Headcount metrics are data points that help you look at the composition, performance, engagement, and efficiency of the employees or different teams within your company. These metrics enable HR and finance collaboration by providing high-level and granular views of headcount, including insight into total number of employees, ratio of total headcount to salary, department and title data, length of employment (within the company and in specific roles), and more.
Categories
Table of Contents
Why Headcount Reporting Metrics Matter to Your Business
Headcount reporting metrics help finance and HR work together toward company growth and culture goals. Along with providing an accurate reflection of department headcount levels across the company, headcount metrics (like most HR metrics) give you insight to help department and HR leaders plan and organize the company’s workforce needs at a granular level.
Because your company invests so much in human capital — as much as 70% of expenses in SaaS — your ability to help guide executive leaders through headcount planning can significantly impact company growth and capital efficiency.
A strong handle on your headcount metrics helps you go into headcount planning processes with the right assumptions about workforce ratios, productivity, and attrition. That understanding of the numbers will help you align headcount plans for your specific stage of growth.
If the company is at the seed or Series A stage, it’s imperative to hire people for product and research to push the product to market. But once it’s time to advertise and sell the product, there needs to be enough capital to ensure the company can begin forming strong marketing and sales teams. This is why collaboration between the HR and finance team is essential for headcount reporting, as you’ll gain better insight into the company’s hiring goals, which you can reflect with more accuracy in the company’s spend forecasting and revenue forecasting reports. And your headcount metrics continue to ground future plans into the present to ensure sustainable growth.
Finally, headcount reporting metrics help the company stay compliant from a few perspectives. A company with more than 50 full-time employees is required to provide healthcare benefits as well as protected family and medical leave. Once the company has over 100 employees, the Equal Employment Opportunity Commission (EEOC) requires the company to provide demographic information. Finance serves as a double-check for HR to accurately track the numbers — otherwise, the company risks being non-compliant with the regulations, which could lead to fines or other disparities. With your watchful eye, you can forecast these employee benefits and prompt sales and customer success teams to explore what their goals need to be in terms of sales and customer retention metrics to reach recurring revenue that funnels back into expanding employee benefits.
Get The 10 SaaS Metrics You Didn’t Know You Needed

10 Important Headcount Metrics for HR Teams
The exact key performance indicators that you should monitor depend on what’s important to the business. As mentioned above, you should at least be tracking your total headcount to make sure you’re on track with compliance requirements
But to fully understand the metrics that are important to the business, you must consider which headcount metrics align with the company’s goals as well as its industry and growth stage. This list is by no means complete, but it serves as a strong foundation.
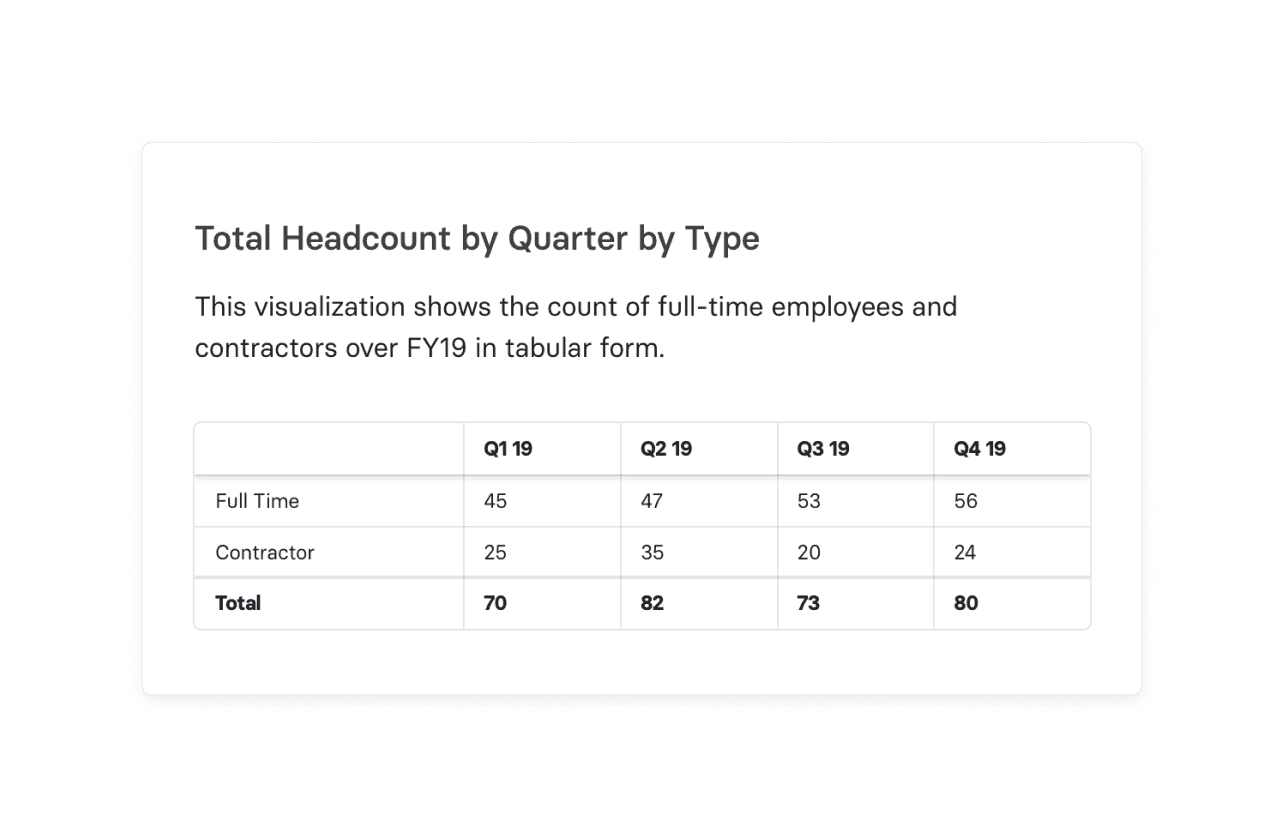
1. Total Headcount
Total headcount is a snapshot of your total number of employees. This is a good number to watch for compliance reasons but also to help you track whether the company is bringing in enough new hires to support its growth plans.
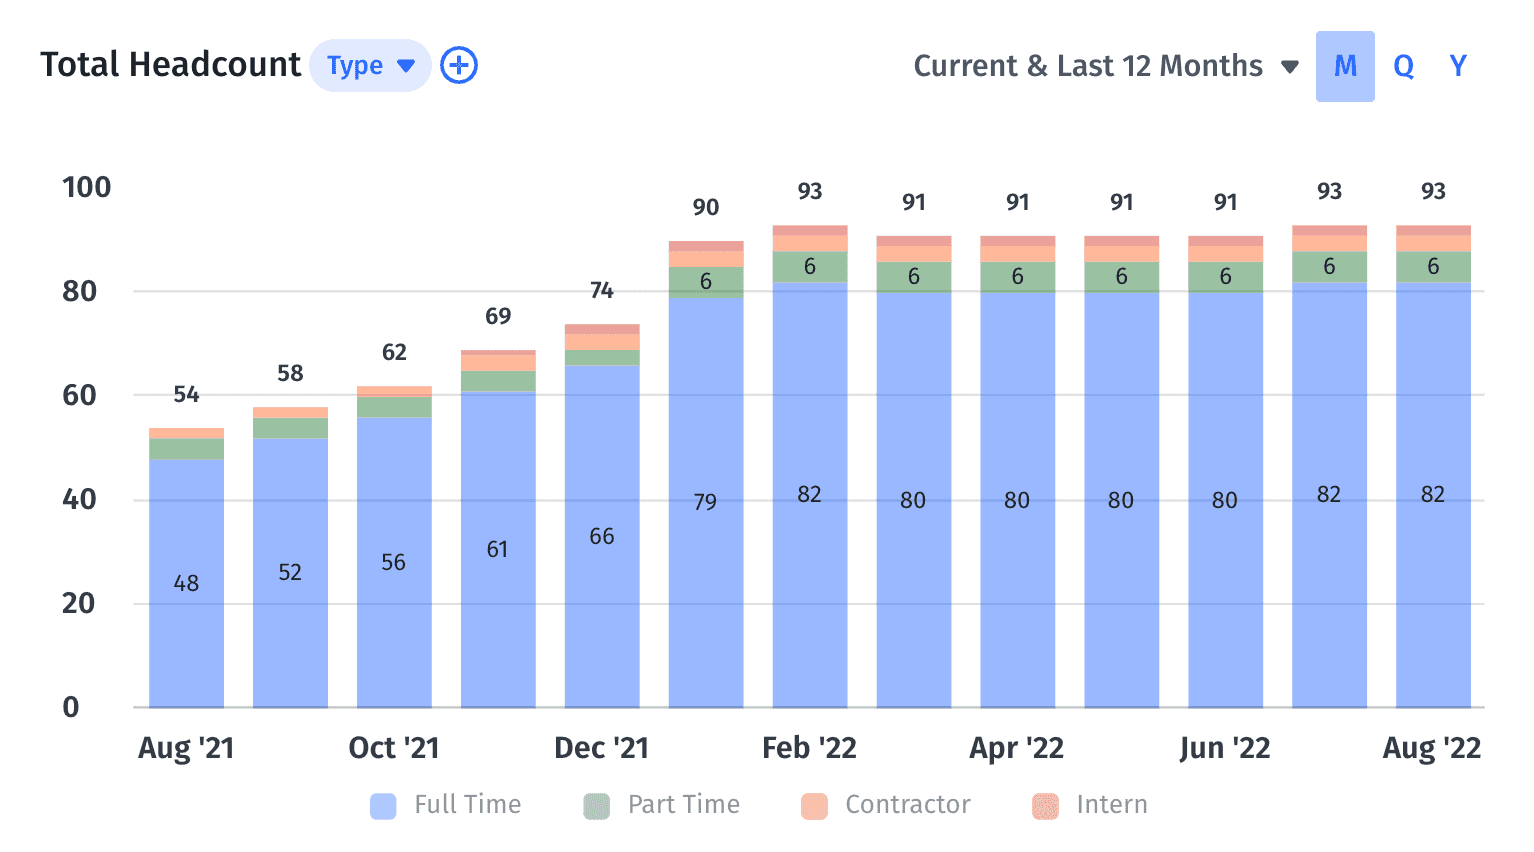
Drilling down into your total headcount by length of employment also provides insight into overall employee retention and engagement.
2. Headcount Composition
Headcount composition further breaks down your total headcount to show how many people are in the various teams and departments in your business. This enables you to compare departmental headcount ratios, such as your HR to employee ratio.
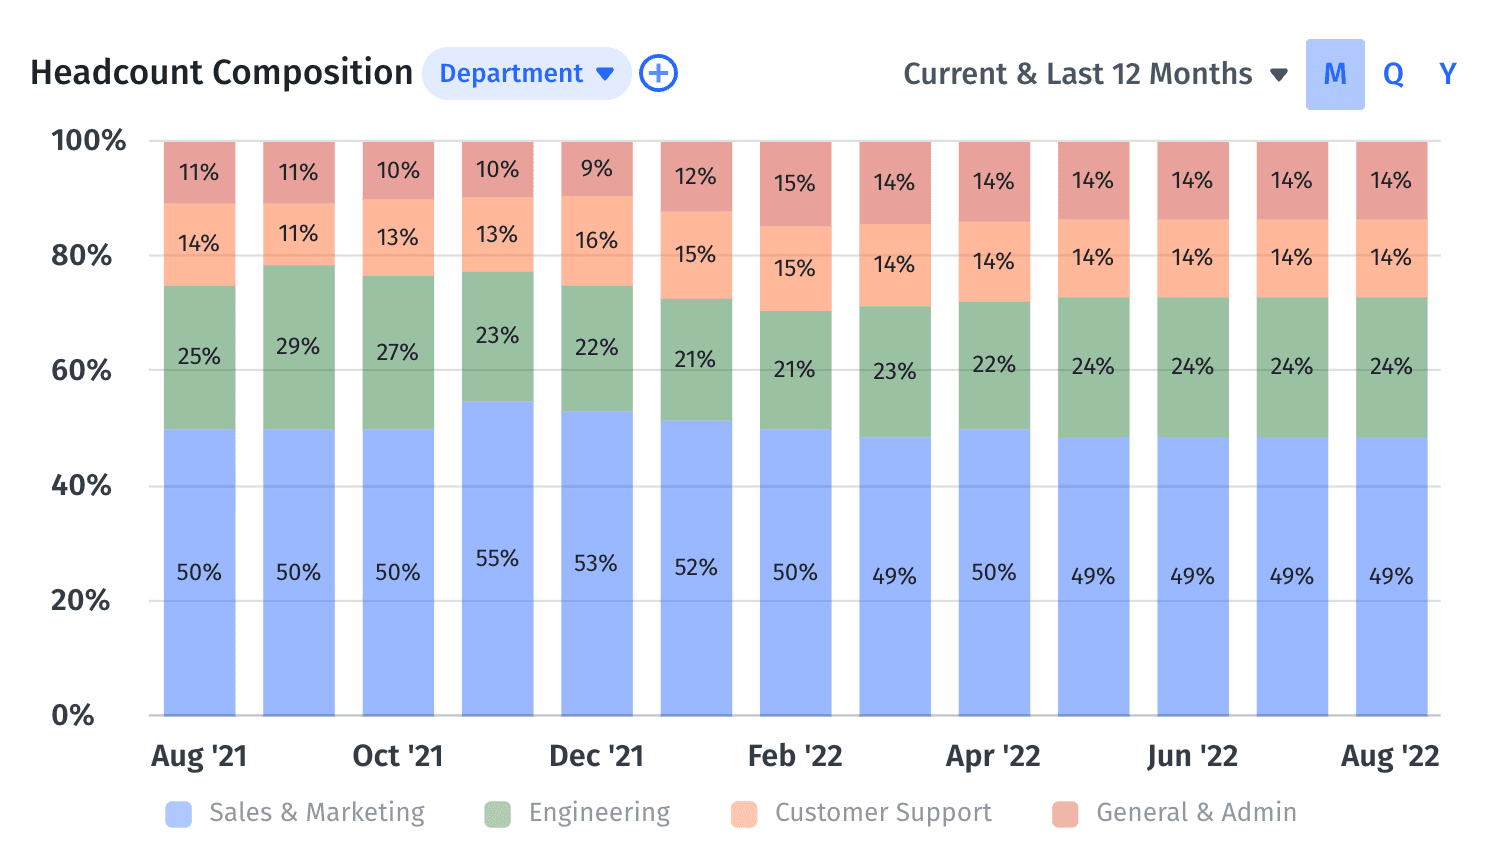
This granularity allows human resource professionals to consider where there may be bottlenecks throughout the company, such as understaffing or staff overages in particular departments. And drilling deeper into the numbers provides ample opportunity for forecasts to be more reflective of real-time data.
3. Headcount Changes
Headcount changes track how many people are added or removed from your total headcount. This is reflected by the number of employees at the beginning of the month, compared to the end. It helps you see what turnover is like at a high level.
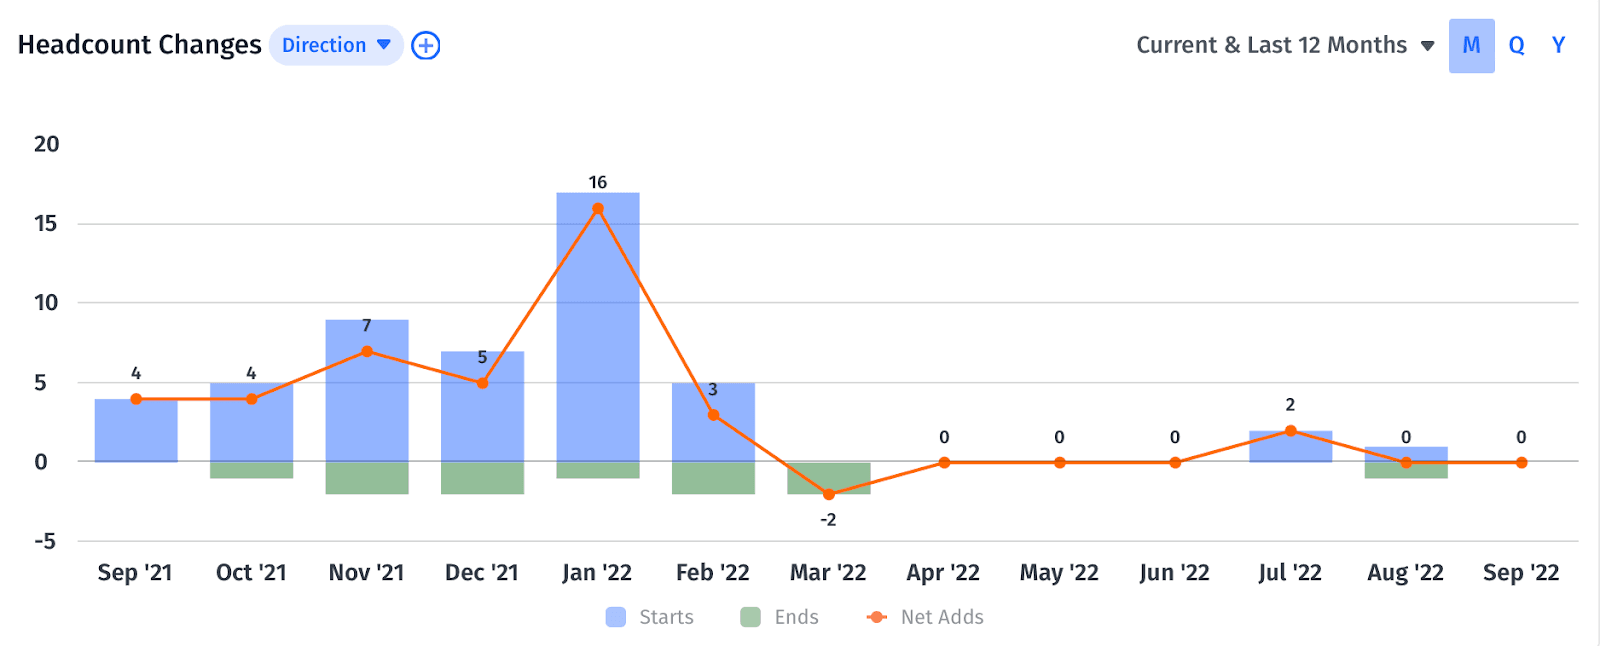
You can measure headcount changes per month, quarter, or annually. HR can then compare the numbers to their overall headcount plan and see how the actuals compare to their projections, and what changes they need to make to ensure they stay on track or adapt their hiring plans.
4. Headcount Start and End Lists
Your headcount start and end lists serve as your granular insight into your headcount change data. These lists include deeper employee data, such as individual names, positions, departments, and whether they were full-time, part-time, or a contractor.
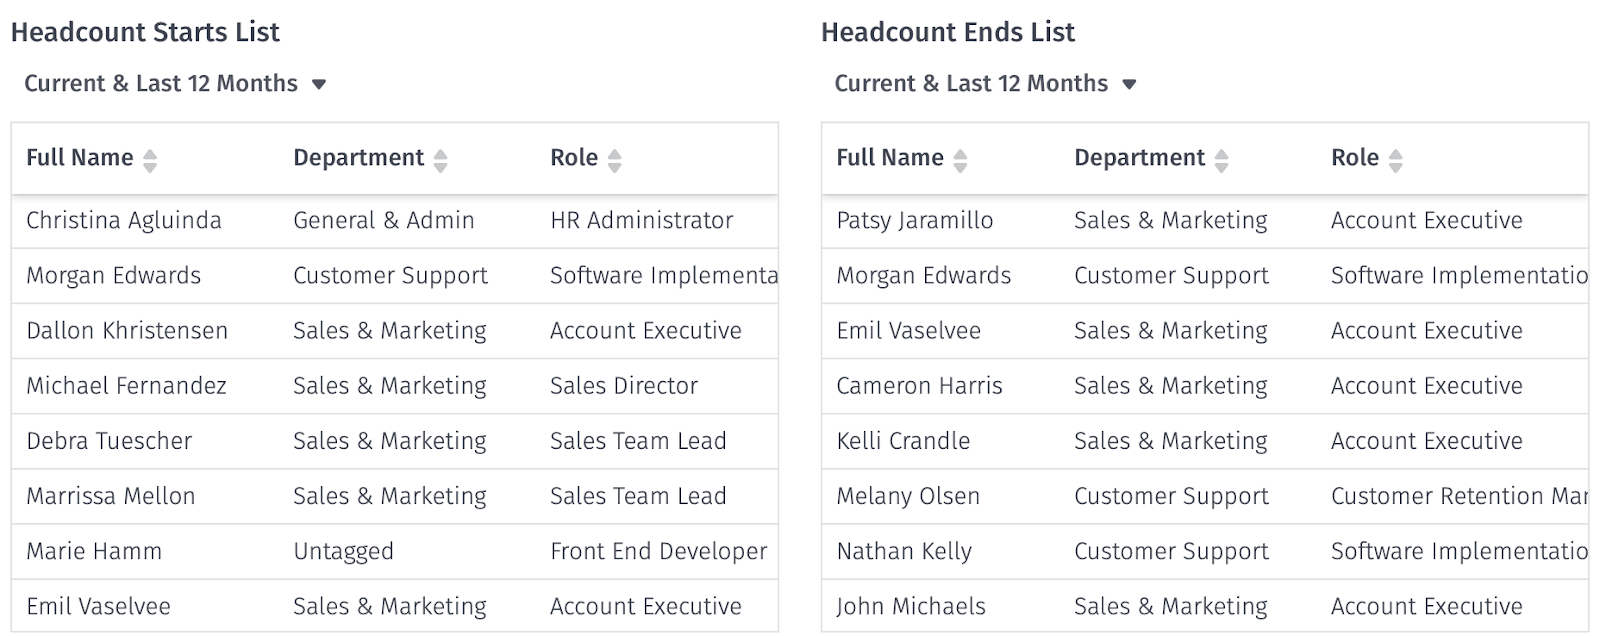
These lists allow department and HR leaders to gain a sense of what turnover looks like for individual departments and the company overall. These leaders can then look for any trends around onboarding periods and tenure, and collaborate on ways to improve employee retention.
5. Employee Retention Percentage
Employee retention percentage (which is the same as employee retention rate) tells you how many employees stay with the company over a designated period of time. This could be shown for the whole company or broken down into teams/departments. The more granular you get, the more HR leaders can gain from insights around employee churn and discover opportunities to improve company culture.
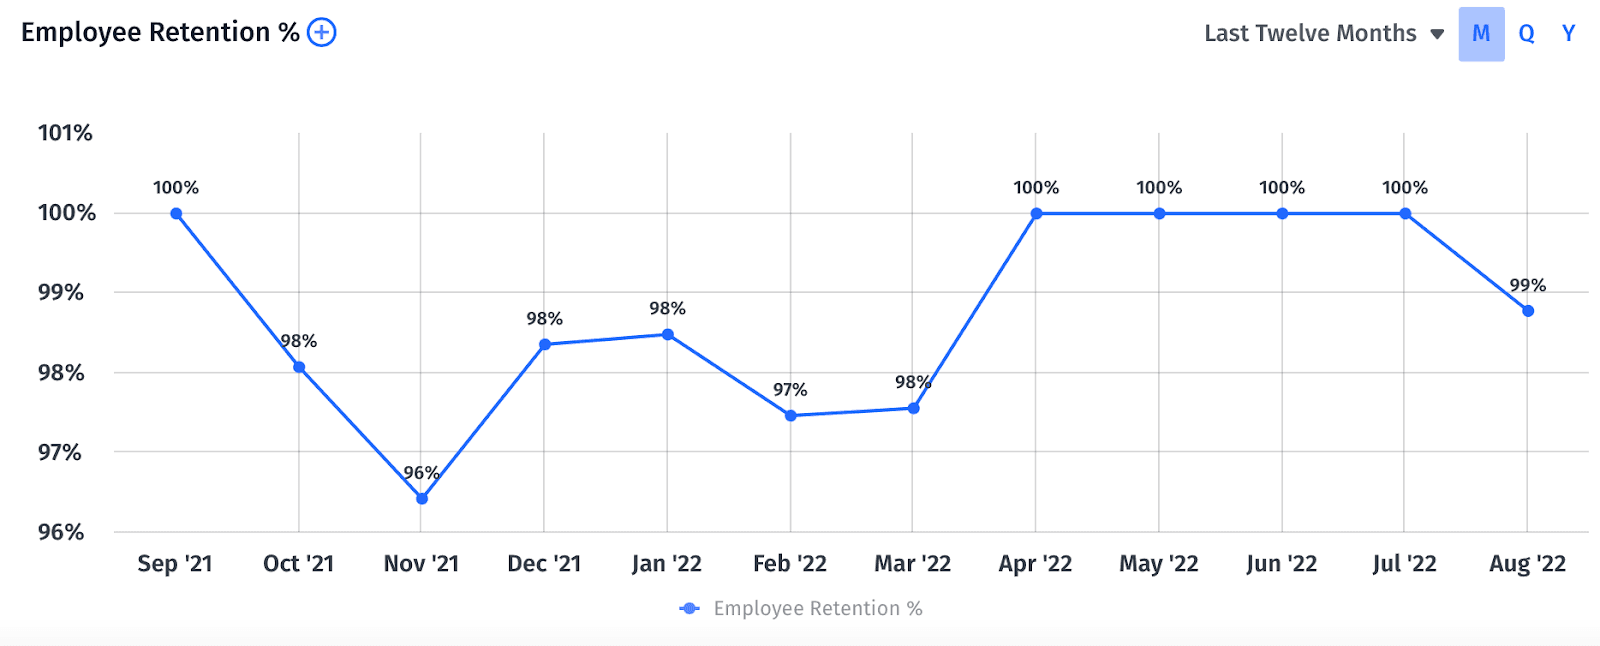
To calculate your employee retention rate, you need to know the number of employees for the first day of the period you’re accounting for. This then allows you to figure out the exact number of employees who departed during that time period.
6. Headcount Length of Employment
Length of employment measures the average time people stay with the company. This is typically measured in months for each department. It’s useful because it helps you understand if there are departments that have high attrition. Knowing these problems exist can help department leaders solve them and increase retention, ultimately saving the company money from having to repeatedly hire and train new employees.
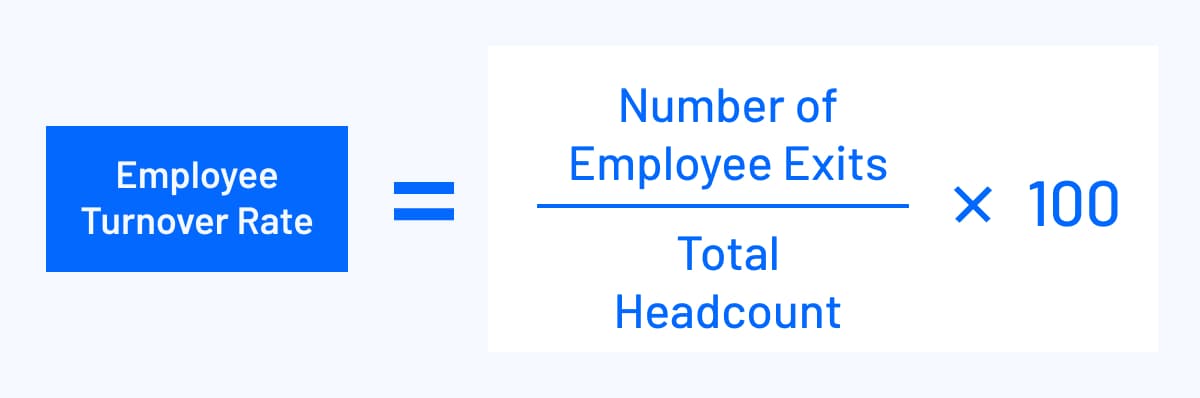
7. Employee Turnover Rate
Employee turnover rate measures how many employees are leaving your organization in a given period of time. The formula remains the same whether you want to calculate overall employee turnover, or go deeper with segmenting the formula for voluntary or involuntary turnover.
A high turnover rate, which is a key employee turnover metric, may be indicative of a toxic work environment, feelings of stagnation in the case of voluntary turnovers, or failure of employees to meet performance requirements or adhere to company policies (as with involuntary turnovers). HR can keep an eye on this metric to flag any opportunities to improve retention for top performers, as well as hire more qualified personnel.
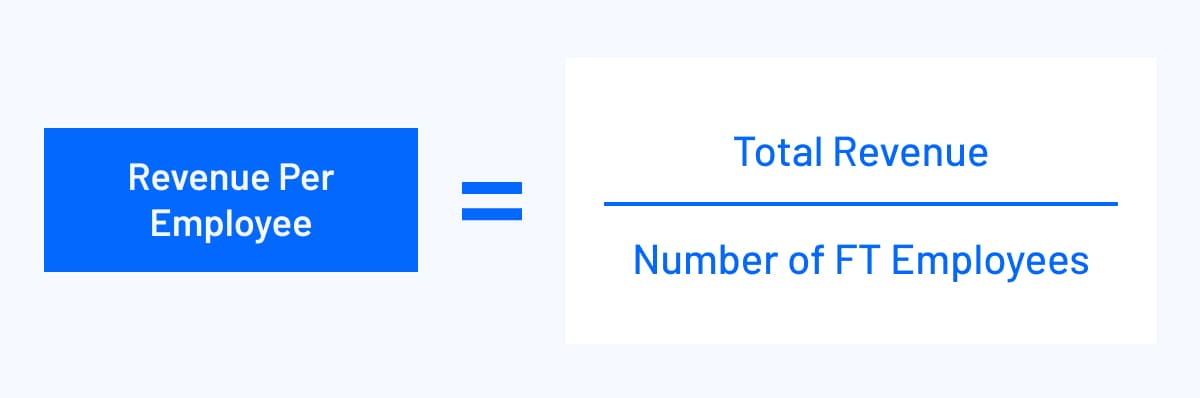
8. Revenue per Employee
Revenue per employee measures how much each person in the organization generates in terms of revenue for the company. You calculate this by dividing the revenue from the last 12 months by the average headcount during the same 12 months.
Revenue per employee provides a growth check in regards to how investments in headcount align in terms of industry standards and the company’s revenue goals.
9. Employee Satisfaction
Employee satisfaction is a lot like a net promoter score for your company. It tracks employee engagement and sets a foundation for the likelihood that current employees would offer referrals and help grow the business.
HR professionals can measure employee satisfaction through surveying employees at least once a year. These surveys usually offer questions where employees rank their satisfaction on a scale of 1 to 10. With these answers, HR can find averages for each question, and determine any next steps to improve satisfaction.
10. Employee Absentee Rate
This HR KPI helps the HR team get a stronger understanding of why employees are missing work, how much work is being missed, and even provides valuable insights into deeper, more structural issues within your organization. This metric doesn’t track planned time off, like vacations or personal days, but rather unplanned absences caused by illness or other emergencies.
To calculate the employee absentee rate, take the number of unexcused absences, divide it by the specific time period you want to calculate, then multiply that result by 100:
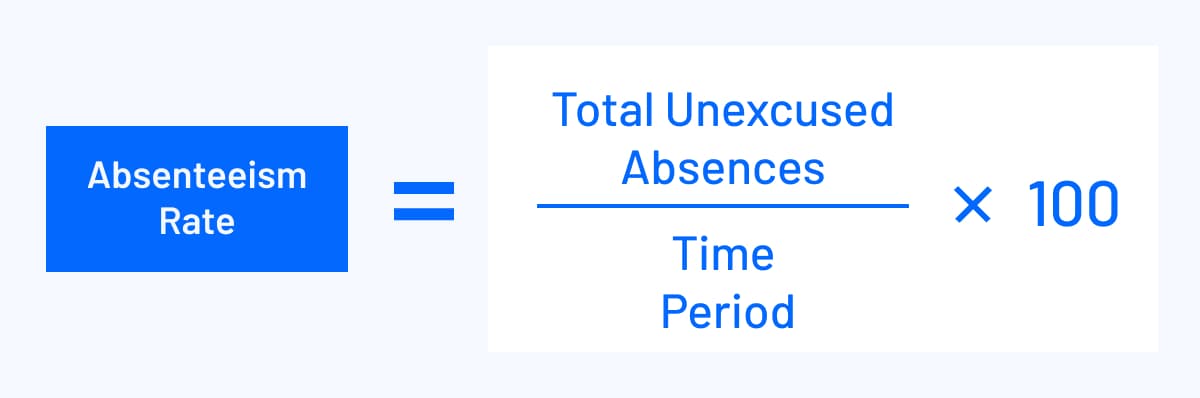
You can calculate absenteeism by individual, team, or across the entire organization. If the rate is high, it may indicate unproductive hours. Department leaders can then consider any corrective measures that need to be taken. And once the company is large enough, the employee absentee rate may impact larger company policies, such as full-company closure around the holidays or particularly heavy travel seasons (like summer).
Unlock a Smarter People Strategy

Mosaic’s Headcount Metric Dashboard Provides Real-Time Data for Proactive Headcount Planning
Mosaic’s headcount planning software, similar to a sophisticated CFO dashboard, provides you with an easy-to-use dashboard that combines key headcount metrics (as well as other workforce planning metrics). Mosaic syncs with your source systems in real-time so you receive accurate numbers whenever you need them.
Want to learn more about how Mosaic can help you stay on top of your employee headcount metrics and lead you to more agile, strategic decision-making? Request a personalized demo today.
Explore Related Metrics


Own the of your business.
