Flux Analysis in Accounting: A Complete Guide

Caden Duve
Customer Success Manager

Build a Clean Chart of Accounts with This Template
As a company grows quickly, it’s critical for business leaders to understand variances in performance each month compared to the last—not just in terms of high-level revenue and expenses, but also at a deeper account level.
A flux analysis, short for fluctuation analysis, does just that.
Flux analysis accounting compares account balances across certain periods of time to provide insight into how a company is doing—and what it could be doing better.
From high-level analysis across all of the payroll to the company’s spend with individual vendors, a flux analysis is a powerful tool for financial analysts who want to support their company’s financial planning and analysis.
Table of Contents
What Is Flux Analysis in Accounting?
A flux analysis is a way to measure fluctuations in account balances between periods of time. It can be monthly, quarterly, or annually, depending on the metric and the intended analysis. It’s most common to run this horizontal analysis for income statement accounts, but it can also be valuable in analyzing balance sheet accounts and conducting balance sheet forecasting to better understand your cash position.
A good flux analysis, much like a good budget variance analysis, doesn’t just stop at noting numeric differences. The data is most useful when you’re able to provide insight into why the variances occur month-to-month. That’s why a flux analysis report includes a brief (but thorough) explanation of any material differences.
A company’s financials are a critical indicator of its overall health, which is why flux analysis is so useful for CFOs, accountants, and business leaders alike. The downside is that it can be a time-consuming procedure to complete with regularity.
Why Is a Flux Analysis Important?
A flux analysis in SaaS accounting can provide several insights that help a company make more informed decisions. You may have a sense of how things are running, but flux analysis provides a level of operational visibility that’s essential for managing a successful business.
After concluding month-end close processes, a flux analysis can provide quality assurance for the accuracy of the data. It can help flag accounting errors like missing or inaccurate data, catch inaccurately booked expenses or revenue, and identify potential losses or fraud.

Flux analysis is an excellent tool for communicating across departments. The data can help monitor the performance of various departments and create a foundation for answering strategic questions. For example, it can help finance work with marketing to determine how much you should spend on ads.
When a large fluctuation occurs, the data can start conversations that lead to business solutions. If you find that your marketing’s ad spend has increased significantly month-over-month, you can work with the team to see whether those expenditures are accompanied by a similar increase in conversions.
For public companies, flux reports are also important as CPAs and auditors will likely require explanations from your business for material fluctuations to give their approval on your financial statements. But private companies can set themselves up for future success by establishing that same level of financial rigor early on. Companies that have visibility into fluxes in financial reporting on a monthly and quarterly basis rather than just at the end of each fiscal year get deeper insight into trends in their data and create a stronger foundation for forecasting the future while making more agile decisions that save time and money in the long run.
Finally, flux analysis can be essential to secure more investors in your startup or small business. If a potential investor has questions about your income statements or wants to pore over cash flow statements, the insights from your flux analysis can provide more visibility into the health of your company.
How To Conduct a Flux Analysis
A basic flux analysis compares lines horizontally in a spreadsheet or table. Depending on the length of time, each column will represent a different month, week, or quarter.
1. Find the Period-to-Period Difference in Values
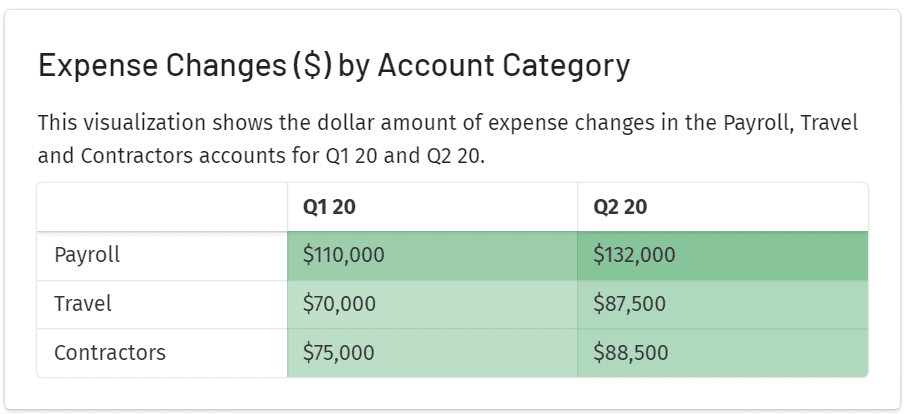
The first step is to find the difference between each period by subtracting the current from the prior period.
To get a better idea of changes irrespective of scale, find the percent change. To do that, subtract the current period amount from the prior period amount. Then, divide that number by the prior period amount.
2. Note Significant Variance
The account you’re analyzing is unlikely to be exactly the same each month. So you need to identify which fluctuations are actually significant and which are normal.
One threshold to consider is materiality. IASB defines material as follows: “Information is material if omitting, misstating or obscuring it could reasonably be expected to influence decisions…”
As the significance of the fluctuations depend on what the account pertains to, there’s no one agreed-upon number. But it’s common to see materiality thresholds of anywhere from 1% to 10%.
Since there’s no rule when it comes to setting materiality thresholds, you’ll have to use your judgment on what to consider material changes. Take into account your company’s overall revenue and the particular risk or importance the account you’re analyzing carries.
3. Provide Explanation
The most crucial part of a flux analysis is the actual analysis. Flux explanations should do more than note where the differences come from and should be written without too much jargon.
Include all the details needed to understand the changes without referencing a spreadsheet. That’s important, as non-expert business leaders or investors may reference these:
- What changed: Include the accounts you’re referencing when it changed and by how much. This ensures all the information needed to understand the flux explanation without looking directly at the data set.
- Why it changed: Many accounts are interlinked in your company, so it’s likely there could be many factors that affected the fluctuation. Note the cause of the fluctuation in detail.
If only a portion of the fluctuation can be attributed to certain causes, be sure to include all causes, noting the extent to which each factor explains the variance. Likely, the most obvious cause of variance isn’t the only one, so it’s important to dive deeper to identify each contributing factor.
How to Do Flux Analysis Faster with Mosaic
With traditional financial analysis, it can be a grueling process to collect and assess the data required. Once financial data is exported, Excel sheets and plugins usually need additional effort in the form of rearranging columns, applying formulas, and troubleshooting outputs—even with templates.
Then, for further analysis, more exports and endless spreadsheets need to be painstakingly combed through. Ultimately, the process can be tedious and time-consuming.
Mosaic offers a better way for accounting teams to analyze data. The platform automatically maps your chart of accounts structure and integrates data from other systems of record, taking out all the legwork of compiling numbers and providing an elegant interface that makes it easy to compare subsets of data.
The visual heatmap provides an immediate look at variances month-to-month, making it faster to identify significant changes. Now, large differences automatically show up on each line item as intensely green or red blocks, which can also be customized to your preferences.
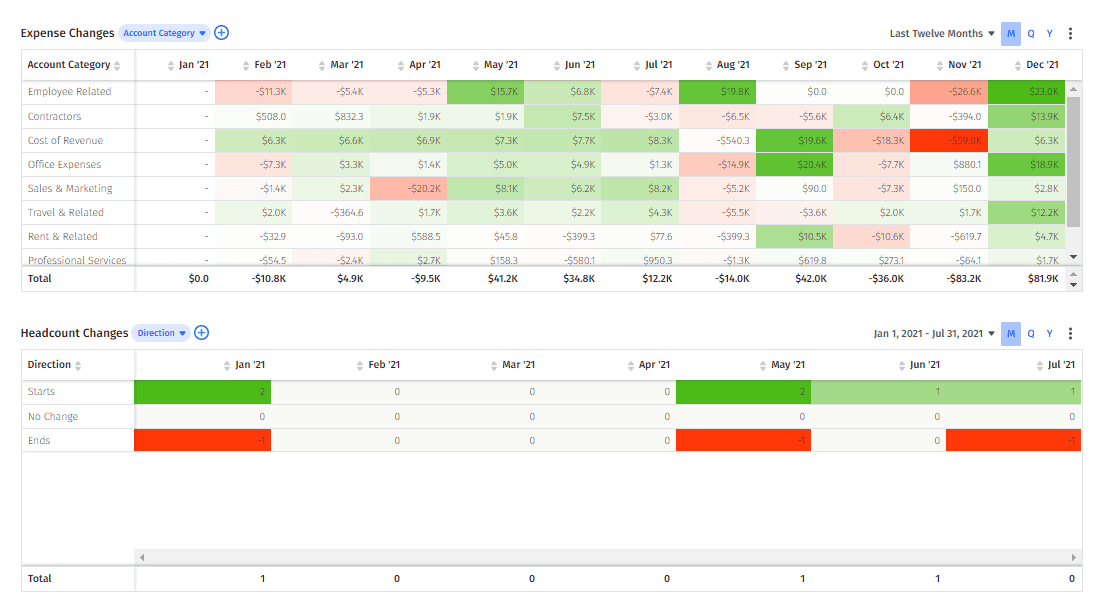
For example, rather than having to export payroll data, apply analysis, and then look for headcount data to compare, Mosaic’s automation can display these insights with just a few clicks.
The data is normalized inherently, so it’s automatically in a readable format. That means it’s streamlined for variance analysis and presentation, even for those unfamiliar with accounting.
It’s easy to switch back and forth from dozens of views, from payroll at a high level to subsidiaries to a single department. That comes in handy when you’re identifying and enumerating the causes of a fluctuation in your analysis. Once different accounts are side-by-side, the relationship between accounts becomes clearer.
When it comes time to share your insights with business leaders, stakeholders, or investors, you can create a custom analysis page highlighting only the data that’s relevant to your points, with just a few setting changes.
In short, Mosaic can completely transform the way teams conduct their flux analysis, making it easier for small finance departments to access big insights.
How to Simplify Financial Analysis with Strategic Finance Software

Final Thoughts: How To Use Flux Analysis for Insights Into Your Business
A flux analysis is an important tool for finance teams and business leaders to keep a pulse on how each element of their business is performing. The insights flux analysis accounting provides can be used to mitigate risks, make strategic business decisions, start conversations, and communicate results to stakeholders.
To conduct a flux analysis, identify the differences between periods, find significant fluctuations, and record the causes for those fluctuations. From there, you can use your analysis for strategic decision-making.
While creating a flux analysis isn’t complicated, it can be tedious to arrange and analyze the data. See just how much Mosaic speeds up your flux analysis by requesting a personalized demo.
Flux analysis FAQs
What is the primary purpose of performing a flux analysis in accounting?
The primary purpose of a flux analysis is to identify changes and variations in financial data. This is done by comparing financial statements over time, which enables organizations to pinpoint inconsistencies, errors, and areas for improvement.


