LTV/CAC Ratio
What Is LTV/CAC?
The LTV/CAC ratio measures the relationship between your customer lifetime value (LTV) and customer acquisition cost (CAC). You can measure the LTV/CAC of individual customers or a cohort of customers within a given time period. The ratio shows your return on investment (ROI) in terms of how much you spent to acquire a customer, and what they have paid you throughout the relationship at the time of calculation.
Categories
Whether it’s through marketing campaigns or sales reps outreach, your marketing and sales departments work within their approved department budgets to get customers through the door and sign on the dotted line.
And while growth is the name of the game, new customers and ARR can’t be the sole mile markers for success. It’s finance’s job to bridge the gap between sales and marketing to understand acquisition costs and add a unique perspective on growth efficiency.
Financial ratios light the path to growth for SaaS companies — and one of the most important financial ratios to analyze a company on the path to financial efficiency with their marketing and sales efforts is the LTV/CAC ratio. Here’s how to calculate your LTV/CAC ratio, why it matters to continuous growth, and how it creates the foundation for customer success.
Table of Contents
How to Calculate LTV/CAC
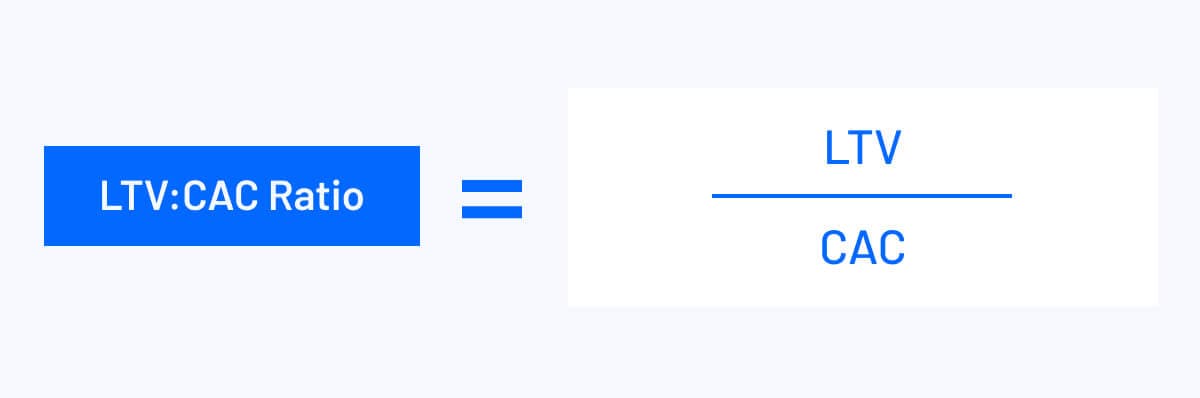
You calculate the LTV/CAC ratio by dividing your LTV by your CAC. But while that seems simple on the surface, you first have to calculate LTV and CAC individually — which can be a challenge.
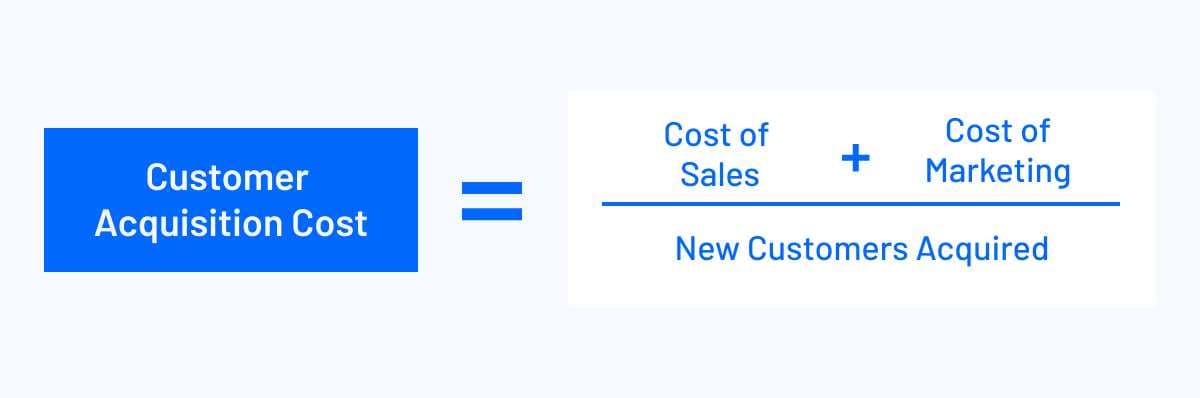
To calculate CAC (the denominator), add any acquisition-specific costs, which include marketing’s efforts with social media, SEO, SEM, and PR strategies, any sales rep travel costs (such as to industry trade shows or meals with customers), and salaries for employees in each department. Then, divide that number by new customers acquired within that time period.
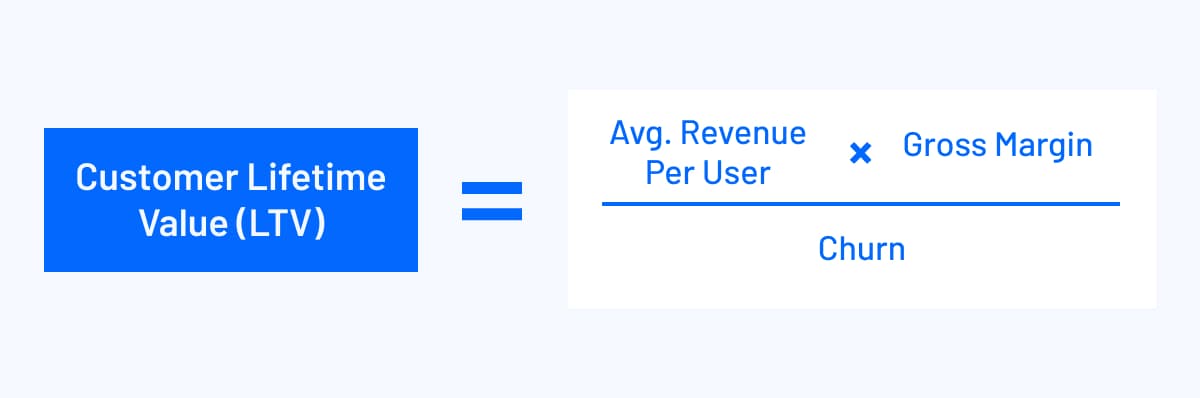
Your numerator (LTV) focuses on the average amount of money you’ll receive from an account (or accounts) over the customer lifetime. First, you’ll look at the average revenue per user (ARPU) over a period of time and multiply it by your gross margin (net sales revenue minus cost of goods sold). Finally, you’ll divide that number by your churn rate (customers that churned leading up to the period of time you’re calculating).
You can calculate LTV:CAC by a single customer or segment to a number of new customers or a cohort of existing customers across a given period of time.
Why LTV/CAC Is an Important Metric to Track (and an Example)
LTV/CAC is a measurement of ROI — and positive ROI indicates some level of growth efficiency. But it’s so much more than that: Profitable acquisition efforts mean that your customer acquisition tactics are working, which leads to further growth in revenue.
Investors care immensely about a company’s solvency (its ability to pay down debts). And if you think of CAC as debt (like Ben Murray, The SaaS CFO, does), the LTV/CAC ratio helps you answer solvency questions by gauging your profitability today (or potential for profitability in the future).
LTV/CAC ratio directly impacts the company’s acquisition strategy. A strong ratio allows for more investment in current customer acquisition strategies or the room to experiment with new ideal customer profiles to capture more of the market. If the ratio is even or low to the point of lost revenue, marketing and sales can evaluate and refine the acquisition strategy toward more and better growth.
Finance can take the LTV/CAC ratio a strategic step further to help the marketing and sales departments with their potential customer retention strategy.
Segmenting the LTV/CAC ratio into customer cohorts helps to inform the company of where they gain the most success (through retention and profitability), which points to specific market segments to target in the future. And if the business offers diversified products, finance can conduct a customer cohort analysis to gain further insights into specific retention and LTV for the company and in regards to competitors.
How a Low LTV/CAC Ratio Impacted Casper Sleep’s IPO
One company to learn from is the mattress-in-a-box company, Casper Sleep. Casper offers mattresses and bedroom accessories (pillows, sheets, etc.) in a direct-to-customer model, and garnered a $1.1 billion valuation in March 2019 after a $100 million Series D funding round. Casper had strong brand awareness, with investments from celebrities like Leonardo DiCaprio and 50 Cent, and sponsored podcasts to continue building its awareness.
However, the tides turned by February 2020, when Casper reported in their S-1 that only 16% of their customers returned to buy other products. That’s the issue with mattresses: While they have a large price tag, if customers don’t return to buy other products or accessories, the LTV is short-lived.
With the heavy investment into their social media acquisition strategy, the short LTV, and the lack of generating recurring revenue, Casper was then valued at $575 million. With a less-than-stellar IPO range which finalized at $12 per share (from $17-19 per share), Casper was eventually bought by private equity firm Durational for $286 million.

ARR/CAC vs LTV/CAC Ratio Compared
Understanding the difference between ARR/CAC (Annual Recurring Revenue to Customer Acquisition Cost) and LTV/CAC (Lifetime Value to Customer Acquisition Cost) ratios is crucial for any SaaS business or startup keen on optimizing their marketing expenses and customer acquisition strategies.
The ARR/CAC ratio focuses on the short-term perspective, measuring the annual recurring revenue generated per dollar spent on acquiring customers. This helps in understanding the efficiency of marketing efforts in a specific fiscal year, offering insights into the average customer’s contribution to total sales within that year. Because ARR is based on bookings, there’s more certainty in this efficiency metric compared to LTV/CAC.
On the other hand, the LTV/CAC ratio offers a long-term view, assessing the total value of a customer over their entire lifespan with the company against the cost to acquire them. A higher LTV/CAC ratio indicates a more favorable return on investment, as it suggests that the customers, over their lifetime, generate significantly more revenue than what was spent to acquire them.
This ratio is particularly important in contexts where customer relationships evolve over time, such as in subscription-based models or businesses with a strong focus on customer retention and referral programs. It also aids in understanding the impact of monthly churn on the long-term value of the customer base.
LTV/CAC Challenges Your Business Might Face
LTV:CAC ratios have an immense impact on financial efficiency and overall impressions of profitability. And while it remains a strong metric and indicator of good tidings, the LTV/CAC ratio is ripe for inaccuracies and oversimplification.
Inaccurate CAC Information
Compiling the data that goes into your CAC calculation (costs of acquisition campaigns and your sales and customer teams’ salaries) requires going into disparate systems. Customer count is in the CRM, salaries and commissions are in the HRIS, and advertising spend exists in your ERP. All systems need to be as accurate as possible at the time of conducting your CAC calculation.
You must also consider if the CAC is weighed correctly. If the CEO assists in any sales call, their salary needs to also factor into CAC.
Fluctuation with Churn and Retention Rates
While working through retention metrics and conducting a churn analysis gives immensely valuable information, customers are susceptible to unpredictable behavior. While the goal of any SaaS company is to make a product or service as invaluable as possible, customers may discover a competitor who better serves their needs or may have to churn due to their own financial situations. Your customer churn rate and retention rate will never truly be constant due to the fluctuation within the marketplace, which is why you must continue looking at these metrics as indicators of the next steps toward profitability, and not a sure sign of profitability itself.
Mistaking LTV for Present Value of Revenue
Churned customers have a defined LTV — but for current customers, LTV indicates the present value of their future net profit. This is why Andreessen Horowitz recommends focusing on contribution margin to calculate LTV instead of gross margin. That approach would help you show the net profitability of a customer instead of their gross margin.
But for early-stage companies, there may not be enough historical data for a detailed LTV calculation in the first year or two. One way to make LTV more accurate in this case is to measure churn in monthly intervals (so 12 and 24 months).
Limits in Company Scope
As the LTV:CAC ratio focuses solely on sales and marketing’s efficiency efforts, it remains a limited scope of the entire business. Burn multiples help recalibrate your entire sense of business activities, especially when market conditions change. Any action along every business function impacts your burn multiple, which is why operational efficiency looks different for a mid-stage company with $100 million in annual recurring revenue (ARR) versus an earlier-stage growth company with $5 million ARR.
What Are Good LTV/CAC Ratios?
Regardless of industry, the standard benchmark for your LTV/CAC ratio is 3:1, meaning a customer will bring in three times what it cost to acquire them.
While any ratio above one serves as a good sign toward profitable efforts, you want to be careful that it’s not too high. An LTV/CAC ratio of 5:1 looks great in theory — but it could mean you’re missing out on major growth opportunities if you’d pour more fuel on the CAC fire. You could increase marketing spend and scale their advertising and marketing efforts.
3 Reasons Your LTV/CAC Might Be Low
If your LTV is lower than your CAC (at 1:1.25, for example), the company is losing money acquiring that customer and will not make it back. And even if your LTV/CAC ratio is at 2:1, you want to aim higher to hit the 3:1 benchmark. Here are three reasons why your LTV/CAC may be low (or lower than you anticipate).
Not Upselling Enough
You need to encourage your customer success team to nurture the relationship with existing customers and suggest upsells at the appropriate time.
Early Customer Churn
Customers anticipate easy product or service integration, but when these needs are not met, customers will churn. The marketing and sales departments need to revisit and re-evaluate the company’s ICPs to ensure product/market fit is there, build excitement, and keep clear communication regarding new features or developments.
The product department may also need to ramp up product development, as the customer may have been a match, but found a different option due to underwhelming product performance or expectations.
Executive Suite Involvement
Your CAC needs to be fully weighted, which includes the salaries of everyone involved in a sale. If your executive leadership (such as the CEO or COO) is part of your sales process, their salaries factor into your CAC calculation. The founder-selling model can be crucial early on, but it makes for a higher CAC payback period, which is why it’s important to find the right time to build out a true sales function.
How to Improve Your LTV/CAC
With the LTV/CAC ratio, you get the 30,000-foot view of how well things are working in terms of financial efficiency for the sales and marketing teams. But to get to that deeper insight, you need to discover the “why” behind the numbers. When finance can collaborate with teams and help department leaders explore the “why,” the function becomes a much more strategic partner in driving efficient growth.
Improving LTV/CAC is a function of pulling the two levers that go into the calculation — LTV and CAC.
To improve CAC, marketing and sales can collaborate on evaluating customer profiles and the marketplace. Marketing strategies can center on more efficient channels, such as social media or content optimization if they have strong engagement and conversion. This works to improve the lead conversion rate, which keeps potential customers in the pipeline for sales to nurture through the sales cycle. The sales department can look at how to shorten and speed up the average sales cycle in order to lessen the impact of their salaries and time on CAC.
If LTV needs to improve, one thing to consider is updating your SaaS pricing strategy. It may be changing your business model from a subscription-based to usage-based platform, or you may simply raise prices then address pricing with existing customers when it’s time to discuss renewals. Sales may also cross-sell other products to create more leeway on the CAC payback period at the point of sale or throughout the relationship.
LTV also relies on your customer success management skills. How effectively are your marketing and CS teams working together to deliver new features to existing customers? Are you seeing upticks in product engagement when new features release? Can you look at retention and renewals by CS rep to understand performance on a deeper level? Keeping close track of your customer success metrics will help you get good answers to these questions.
Finance can dig into the data to help answer these questions, unlocking insights that can help reduce churn and improve LTV.
Measure Your LTV/CAC in Real Time with Mosaic
Mosaic is a powerful integration that syncs with your source systems to help eliminate errors with any data reconciliation. What this means for your LTV/CAC is that you can create properly attributed calculations in no time, especially with Mosaic’s pre-loaded metrics and templates.
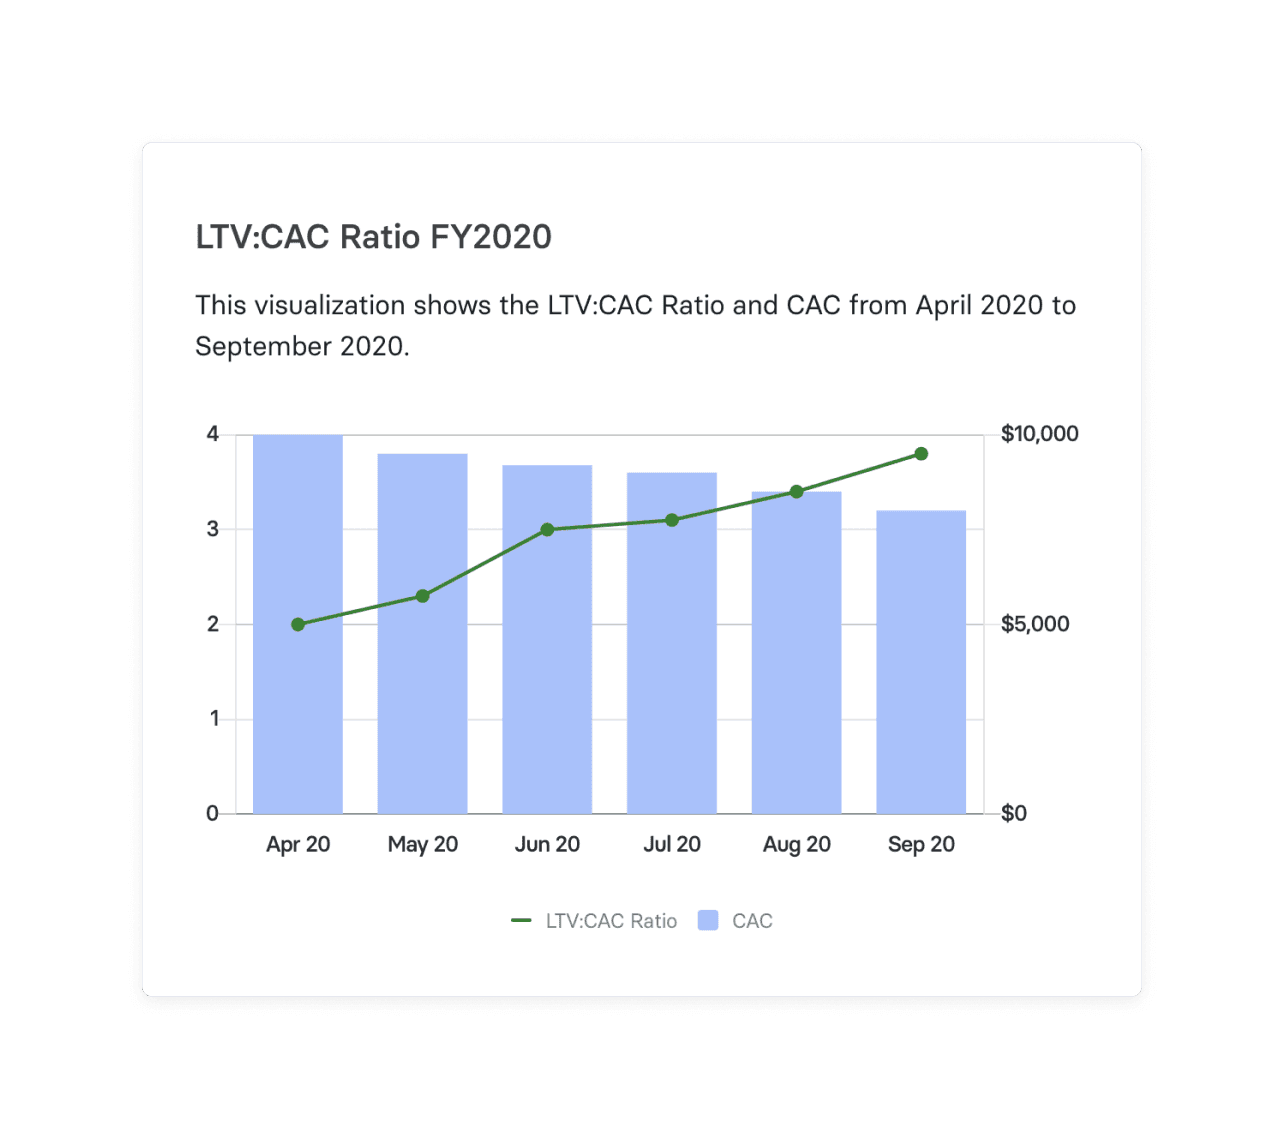
With Mosaic, you can visualize your LTV/CAC ratio by overlaying CAC alongside your LTV calculation:
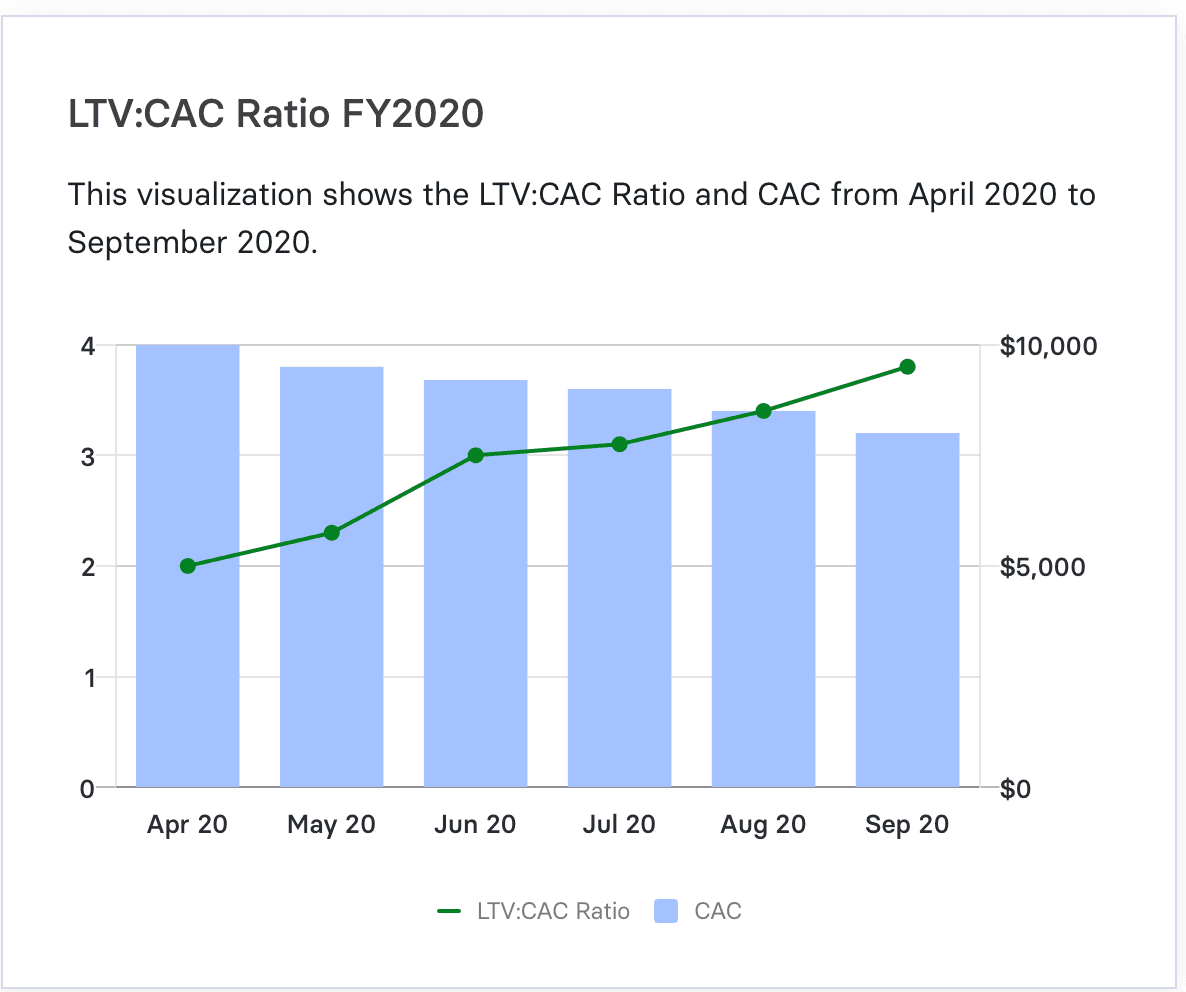
In this visualization, the X-axis stands for time, broken down by month and year. The left Y-axis is your LTV/CAC ratio, while the right Y-axis represents your CAC. You also have the option to pull up a pre-loaded LTV dashboard and CAC dashboard on their own to look at these metrics side by side. You don’t have to worry about outdated data, either: Mosaic pulls and updates data in real time so you have accurate actuals anytime you need to dive into the numbers.
Mosaic saves time on data aggregation and reconciliation to help you focus on digging deeper into the “why” behind the numbers. Your insights help make collaboration easier and garner better, more strategic insights that help improve acquisition and customer retention for optimal company growth. Request a personalized demo and uncover the story your customers are telling you through these metrics today.
LTV/CAC Ratio FAQs
What's the difference between ARR/CAC and LTV/CAC ratios?
The primary difference between ARR/CAC and LTV/CAC ratios lies in their time scope and focus. ARR/CAC measures the annual return on investment in acquiring customers, making it a short-term indicator of marketing efficiency and immediate revenue generation. It’s particularly relevant for understanding the impact of marketing expenses within a specific fiscal year.
In contrast, the LTV/CAC ratio is a long-term measure, evaluating the overall value of a customer over their entire lifespan with the company against the acquisition cost. This ratio is key for assessing the sustainability of the customer base and the long-term profitability of marketing strategies, especially in SaaS businesses where customer relationships and monthly churn rates significantly influence the company’s growth trajectory.


